| 2 spectra, DVAIAK |
0.000 |
|
0.767 |
|
0.000 |
0.000 |
0.199 |
0.034 |
0.000 |
|
| 27 spectra, GTSQENIAR |
0.000 |
|
0.868 |
|
0.075 |
0.000 |
0.000 |
0.057 |
0.000 |
|
| 1 spectrum, YGVQGALDFEDTWK |
0.000 |
|
0.743 |
|
0.032 |
0.098 |
0.000 |
0.127 |
0.000 |
|
| 3 spectra, VHLVMEK |
0.000 |
|
0.887 |
|
0.000 |
0.000 |
0.000 |
0.113 |
0.000 |
|
| 19 spectra, QGYAPSER |
0.000 |
|
0.798 |
|
0.000 |
0.101 |
0.083 |
0.018 |
0.000 |
|
| 12 spectra, IQDFQQNEELFR |
0.000 |
|
0.891 |
|
0.000 |
0.063 |
0.003 |
0.043 |
0.000 |
|
| 9 spectra, EVIEIAEK |
0.000 |
|
0.819 |
|
0.000 |
0.101 |
0.000 |
0.080 |
0.000 |
|
| 6 spectra, YCALPQIVK |
0.000 |
|
0.811 |
|
0.000 |
0.000 |
0.066 |
0.115 |
0.008 |
|
| 6 spectra, GPLKPHDYPK |
0.023 |
|
0.698 |
|
0.000 |
0.084 |
0.125 |
0.070 |
0.000 |
|
| 3 spectra, EVKPPGMTVMK |
0.000 |
|
0.809 |
|
0.087 |
0.000 |
0.000 |
0.104 |
0.000 |
|
| 5 spectra, NNGCLVVLPGTHK |
0.000 |
|
0.791 |
|
0.000 |
0.186 |
0.000 |
0.023 |
0.000 |
|
| 13 spectra, GDTVFFHPLLIHGSGR |
0.000 |
|
0.755 |
|
0.000 |
0.037 |
0.015 |
0.193 |
0.000 |
|
| 14 spectra, NLVSDDDIQR |
0.000 |
|
0.876 |
|
0.000 |
0.034 |
0.000 |
0.091 |
0.000 |
|
| 6 spectra, FYEENGFLVIK |
0.000 |
|
0.871 |
|
0.000 |
0.129 |
0.000 |
0.000 |
0.000 |
|
| 3 spectra, WEGGVNK |
0.000 |
|
0.895 |
|
0.008 |
0.000 |
0.000 |
0.096 |
0.000 |
|
| 23 spectra, MYHGIQDYDPDSPR |
0.000 |
|
0.629 |
|
0.000 |
0.100 |
0.059 |
0.212 |
0.000 |
|
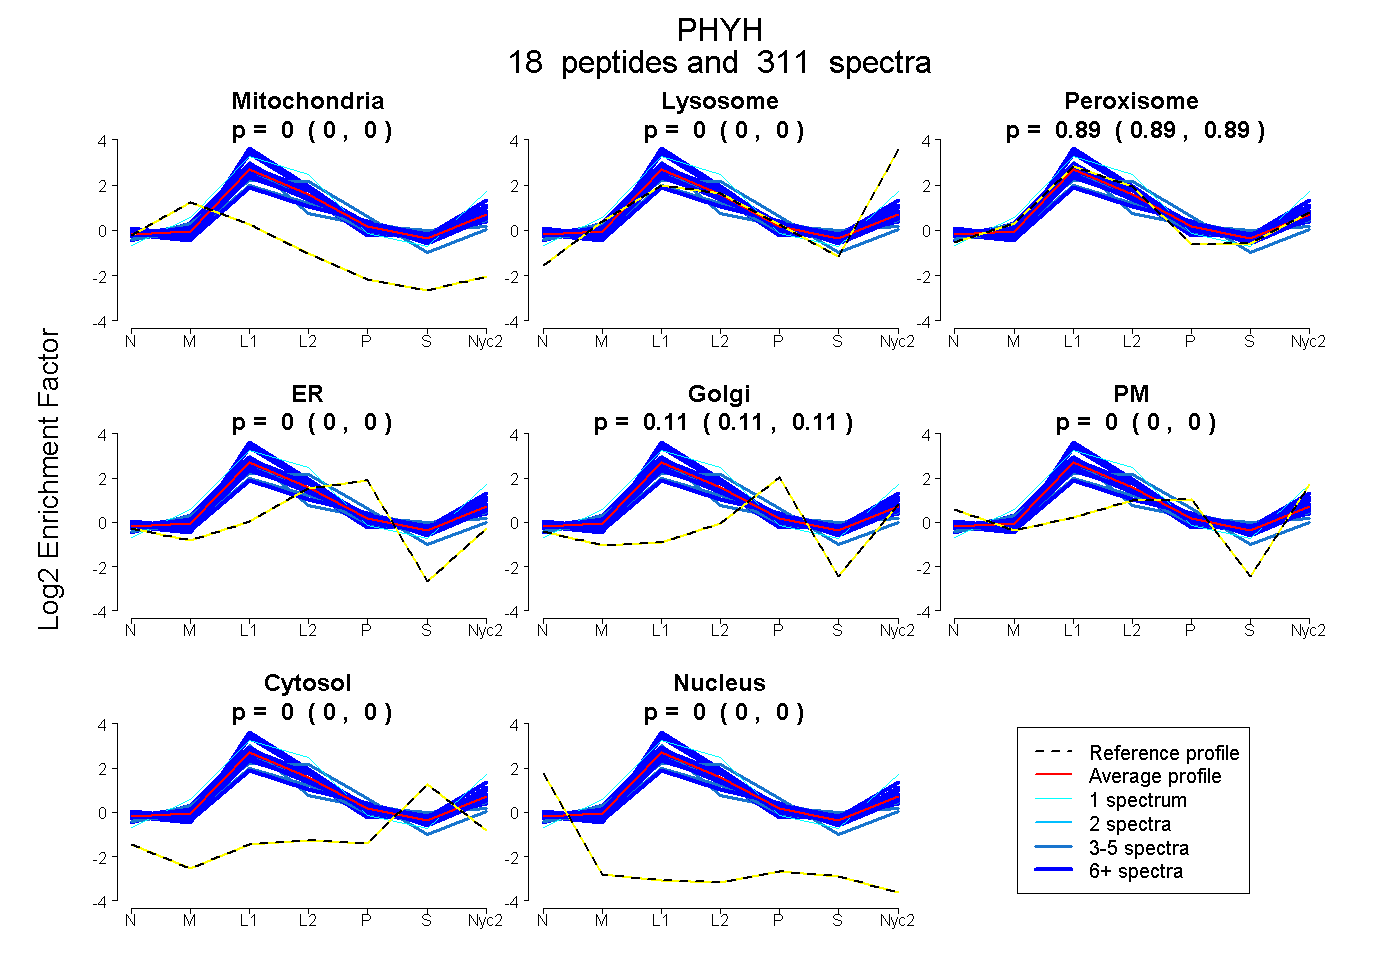
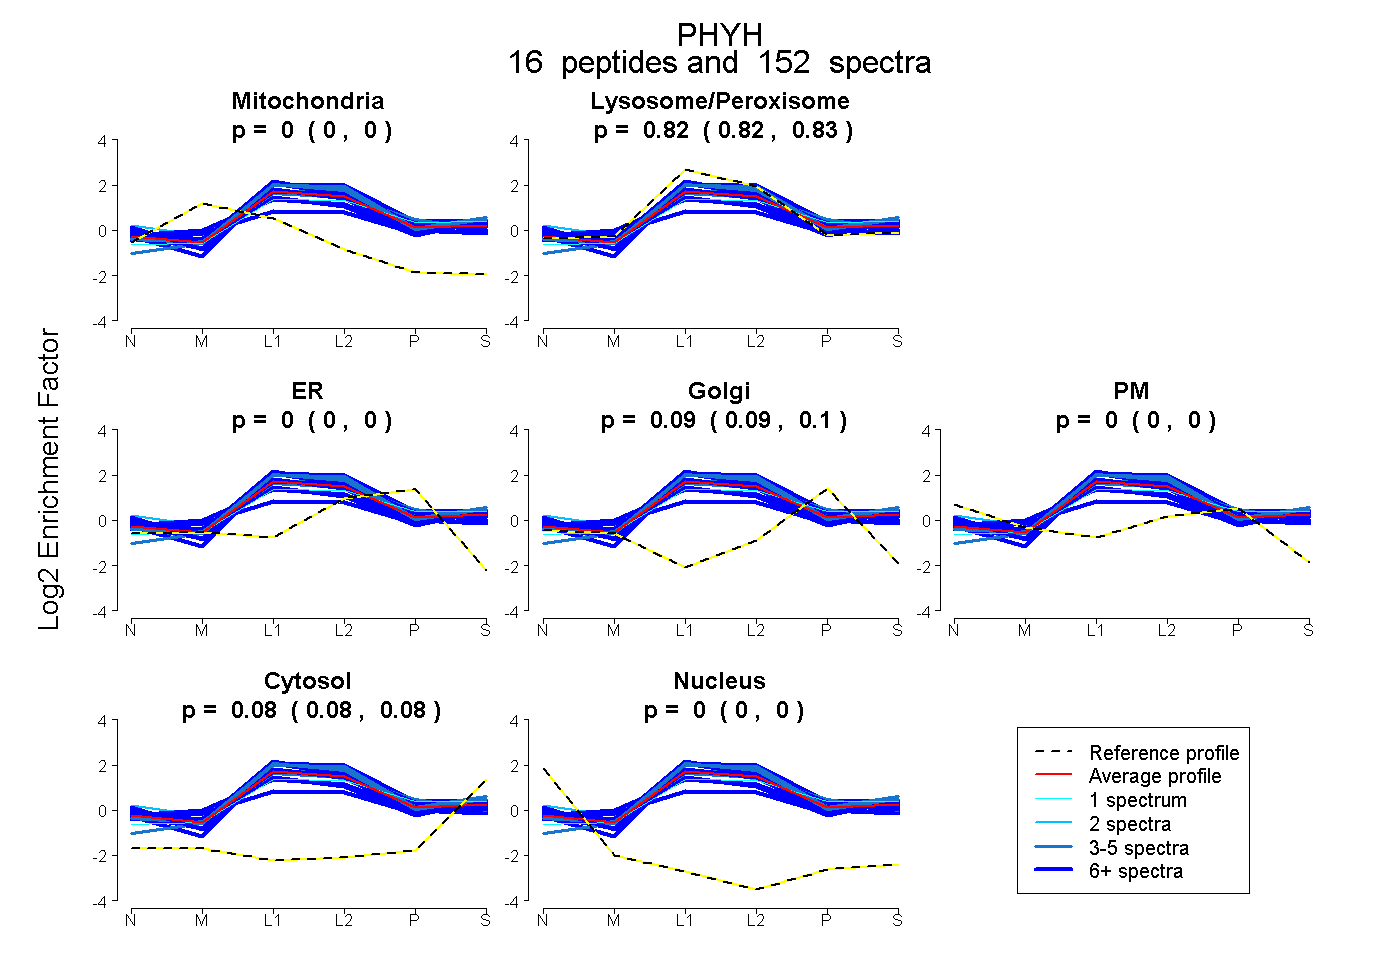
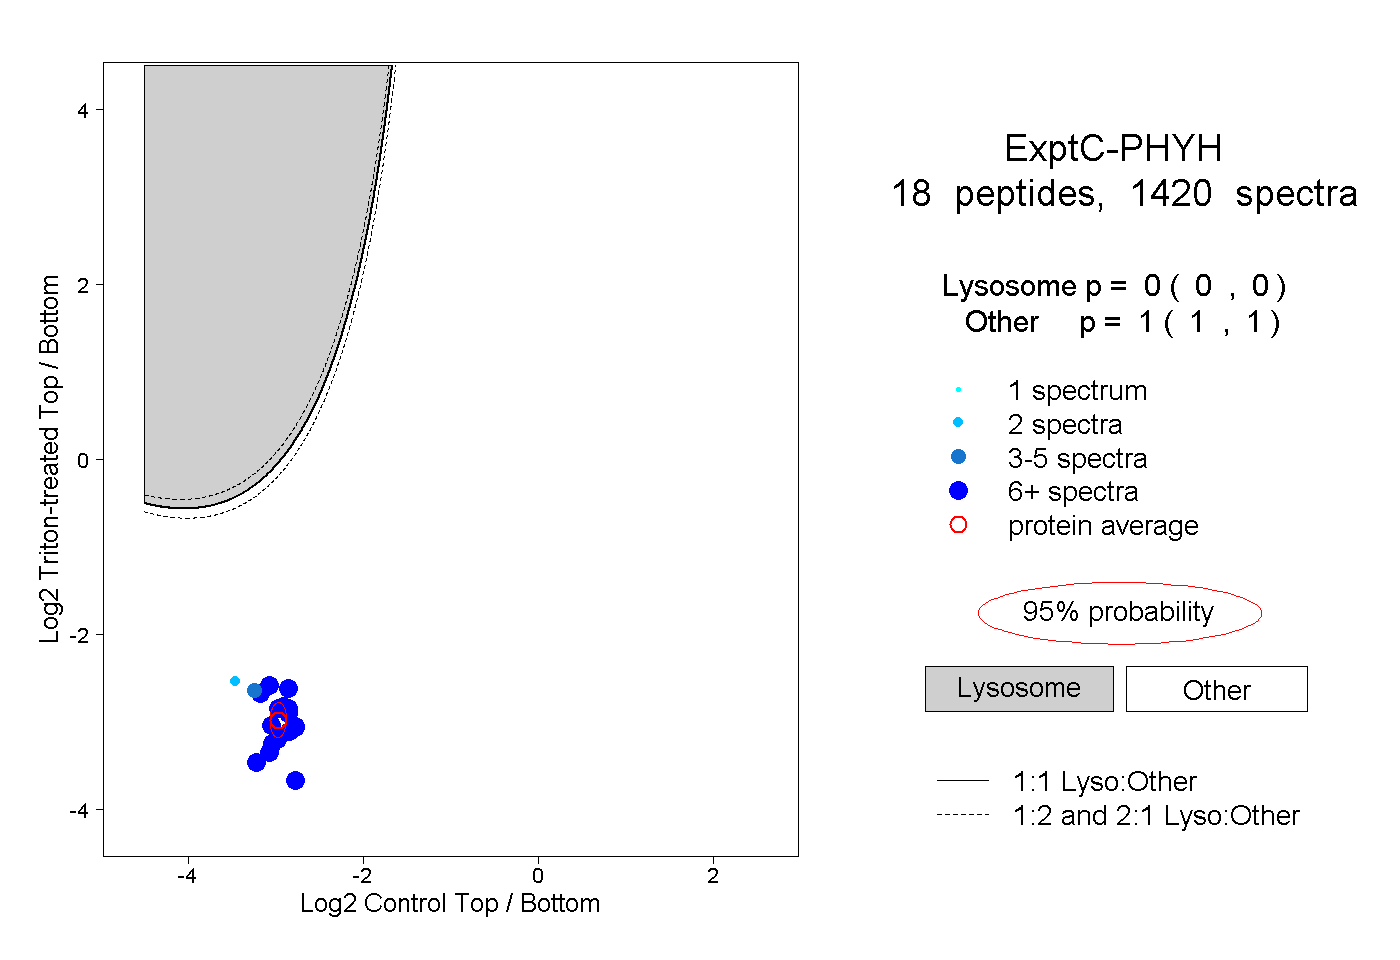
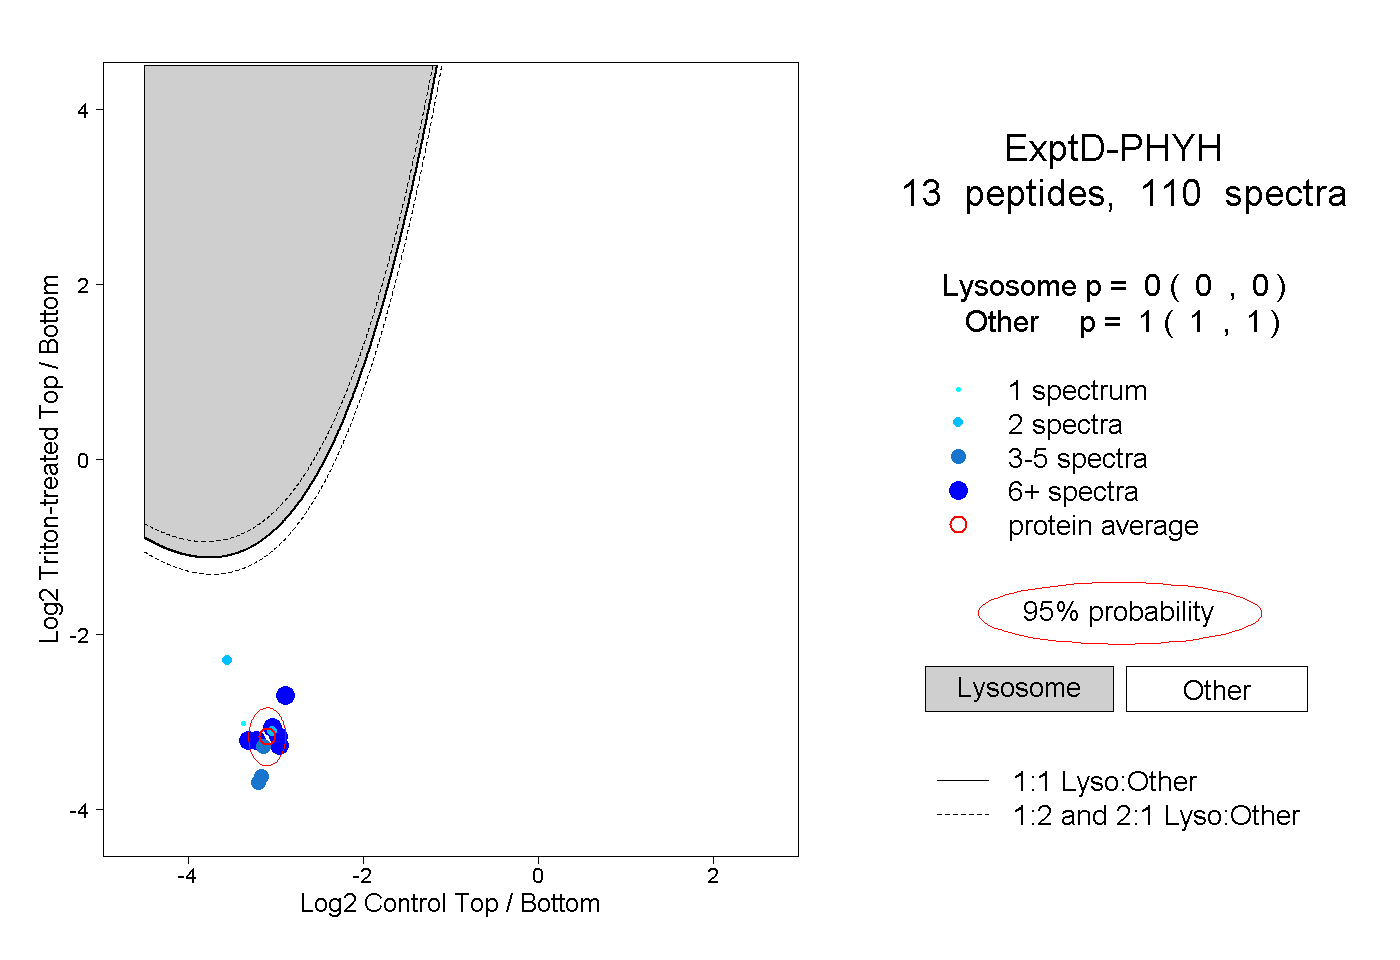
 18
18