 11
11peptides
spectra
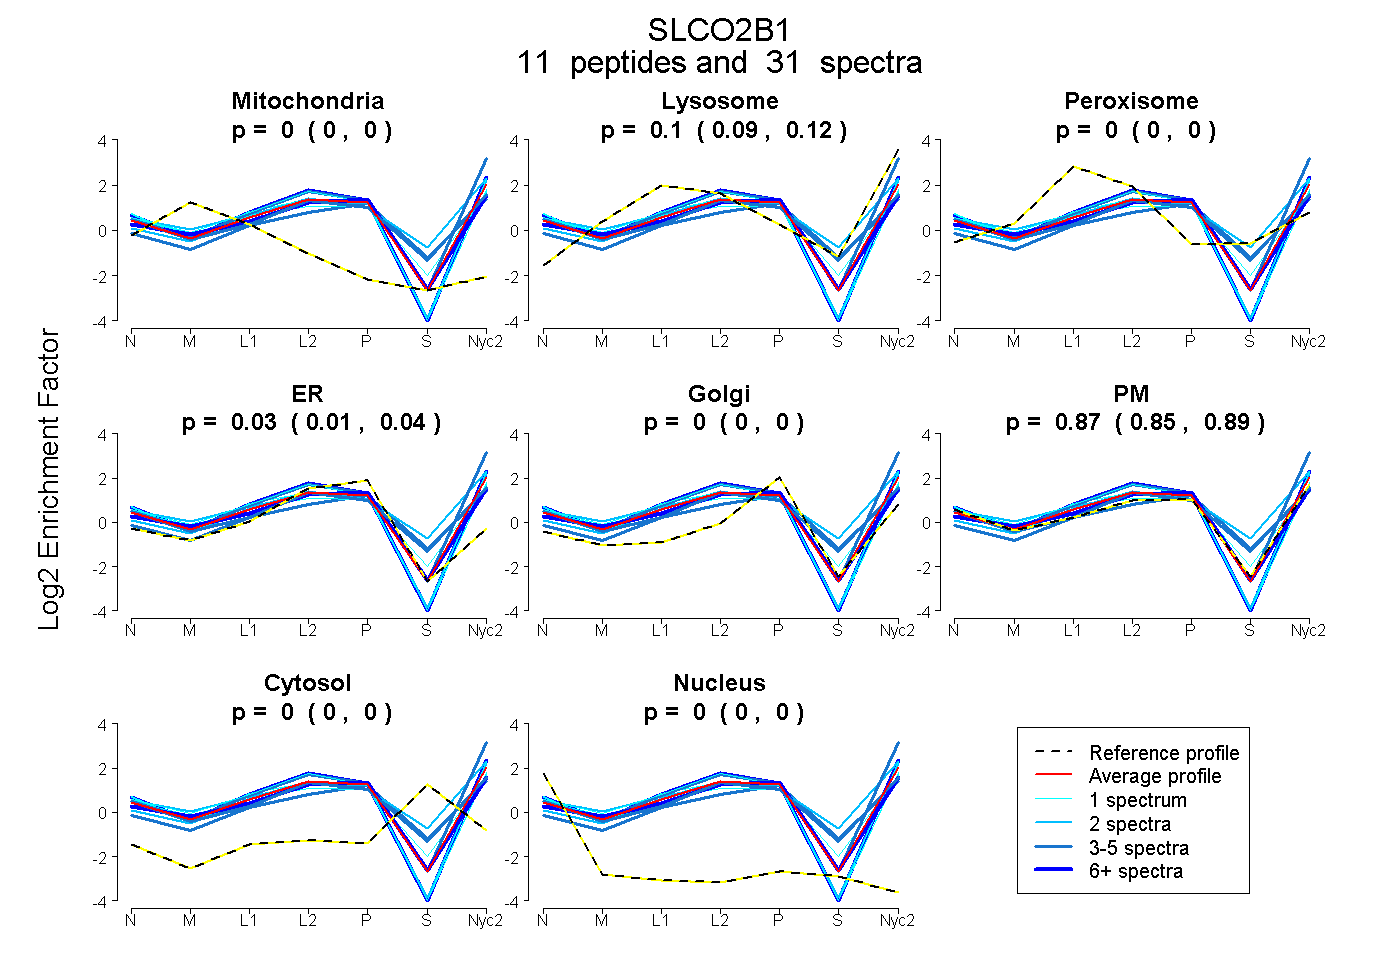
0.000 | 0.000
0.087 | 0.116
0.000 | 0.000
0.005 | 0.043
0.000 | 0.000
0.845 | 0.893
0.000 | 0.000
0.000 | 0.000
1peptide
spectra
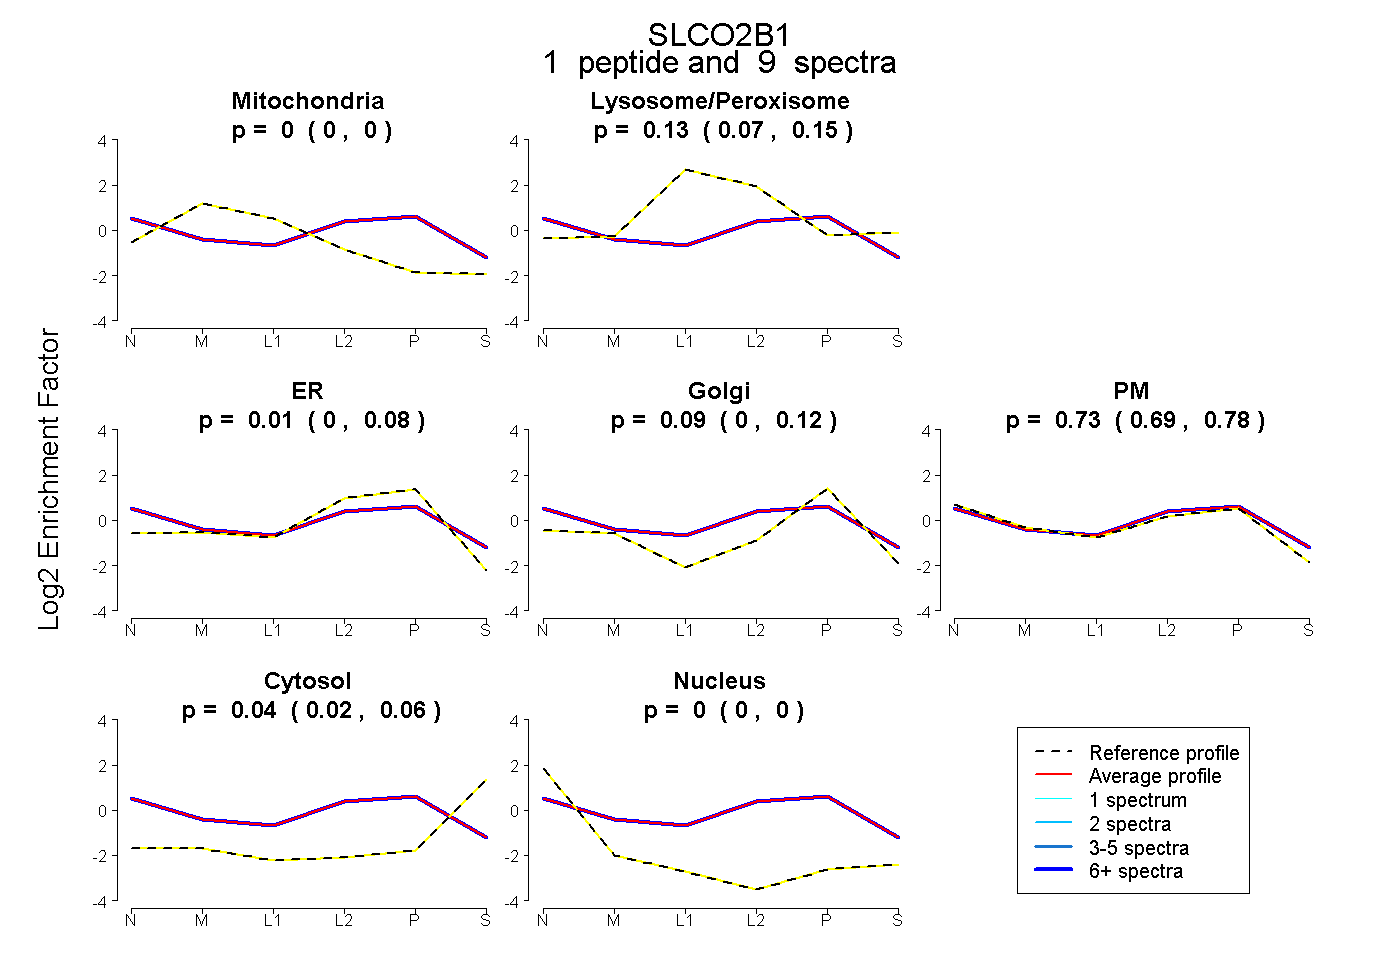
0.000 | 0.000
0.070 | 0.148
0.000 | 0.080
0.004 | 0.117
0.688 | 0.778
0.024 | 0.065
0.000 | 0.000
9peptides
spectra
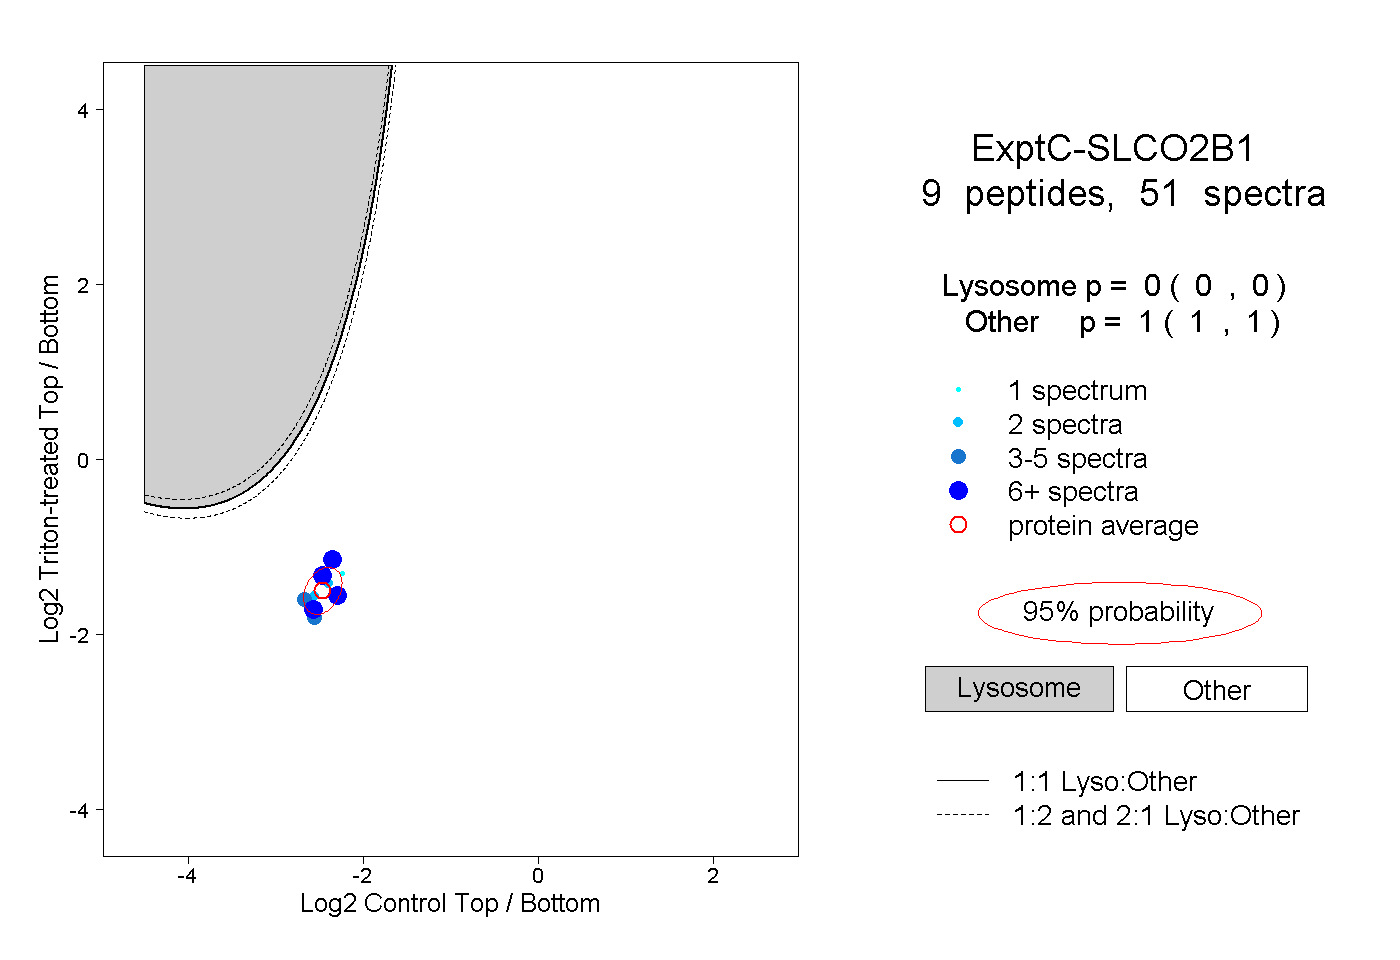
0.000 | 0.000
1.000 | 1.000
3peptides
spectra
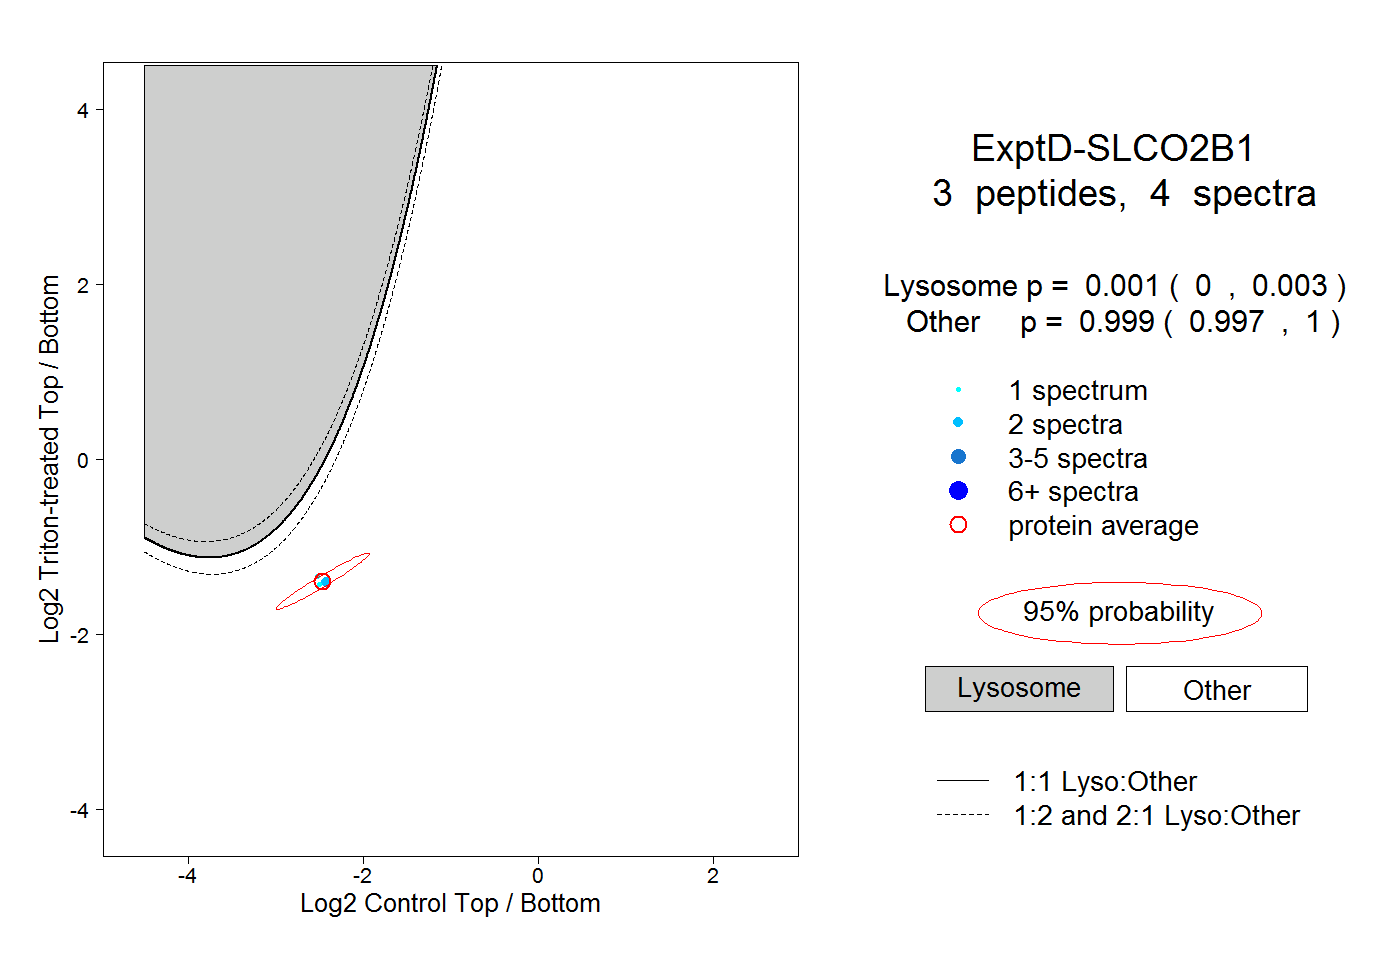
0.000 | 0.003
0.997 | 1.000