 11
11peptides
spectra
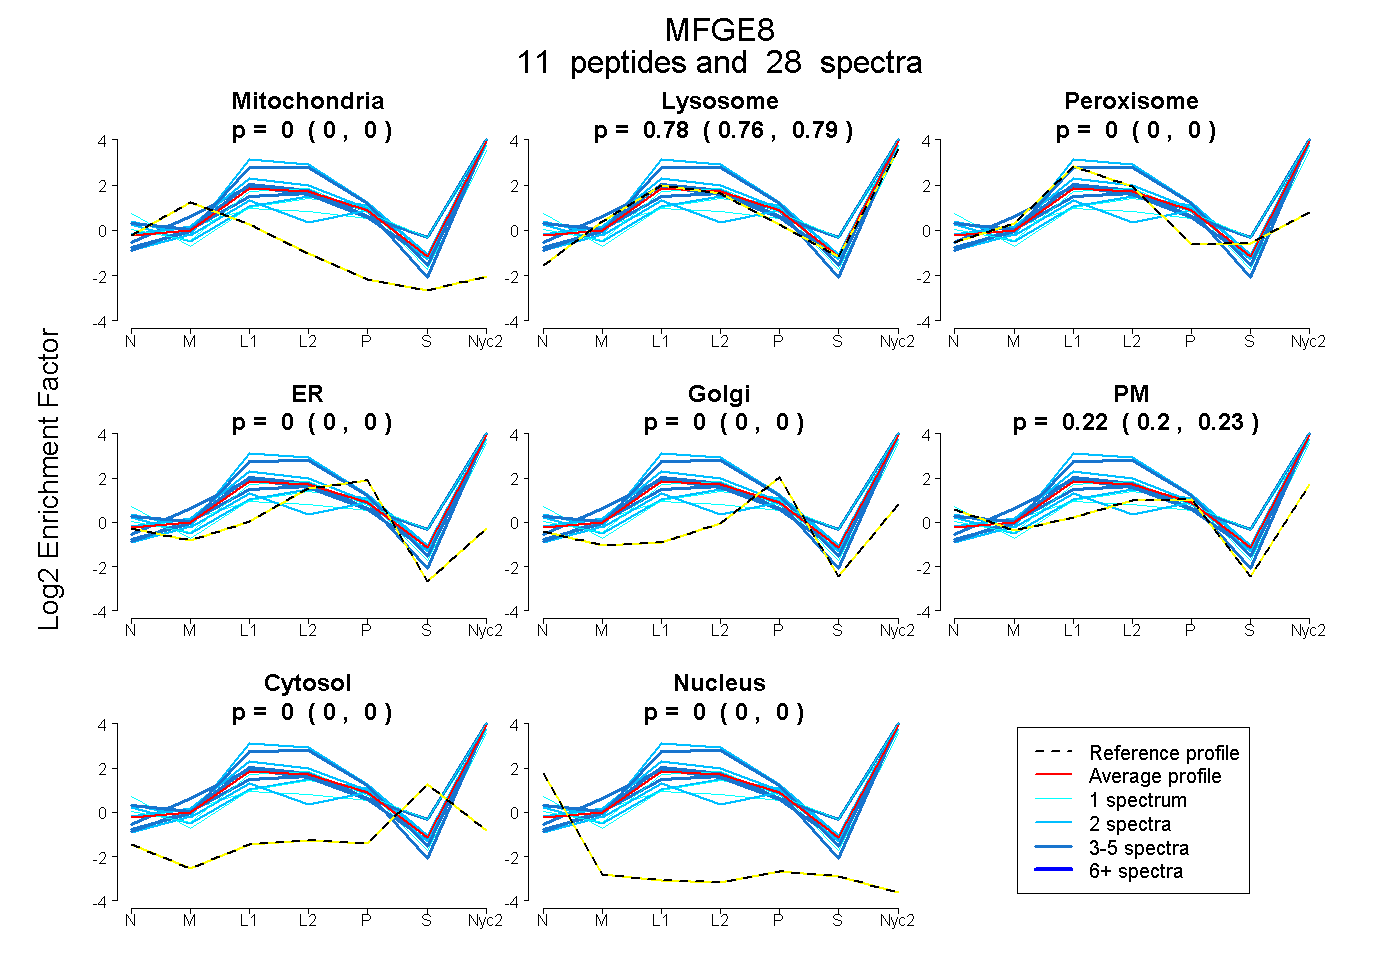
0.000 | 0.000
0.765 | 0.792
0.000 | 0.000
0.000 | 0.000
0.000 | 0.000
0.205 | 0.233
0.000 | 0.000
0.000 | 0.000
1peptide
spectra
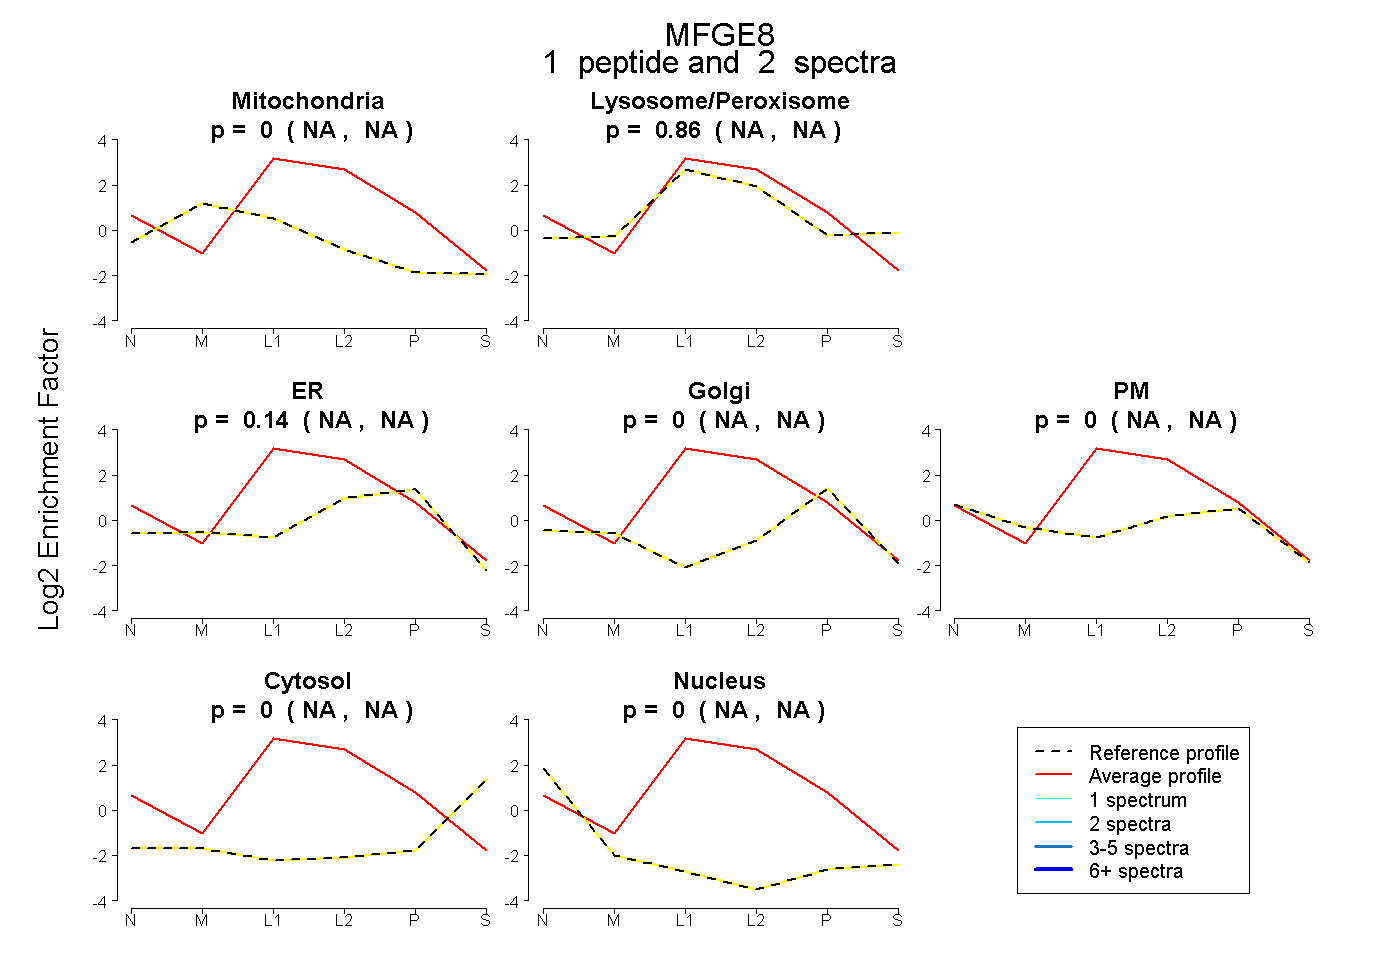
NA | NA
NA | NA
NA | NA
NA | NA
NA | NA
NA | NA
NA | NA
14peptides
spectra
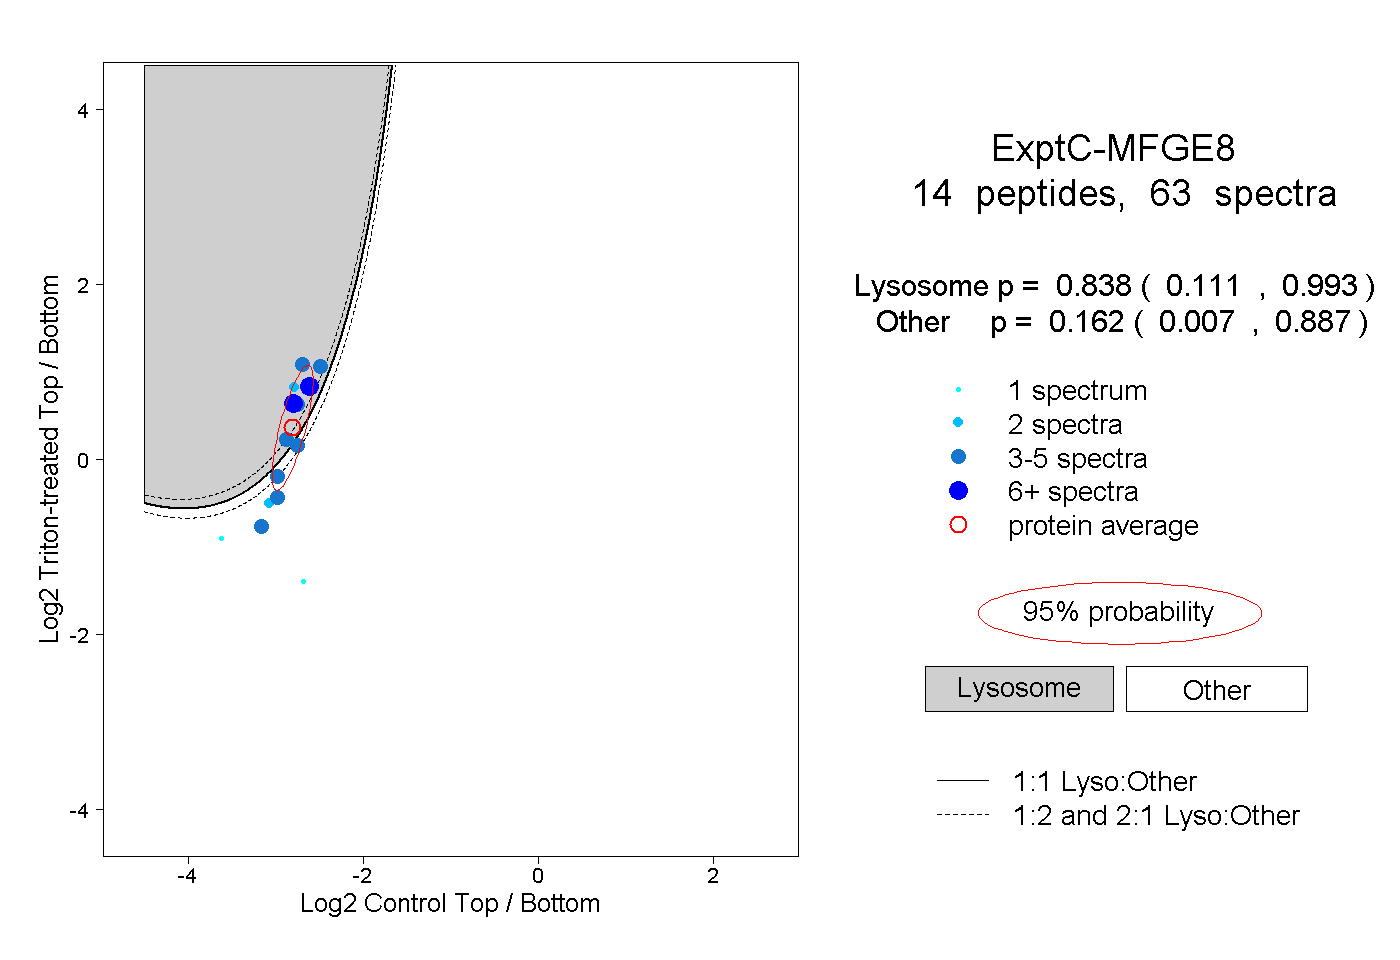
0.111 | 0.993
0.007 | 0.887
1peptide
spectrum
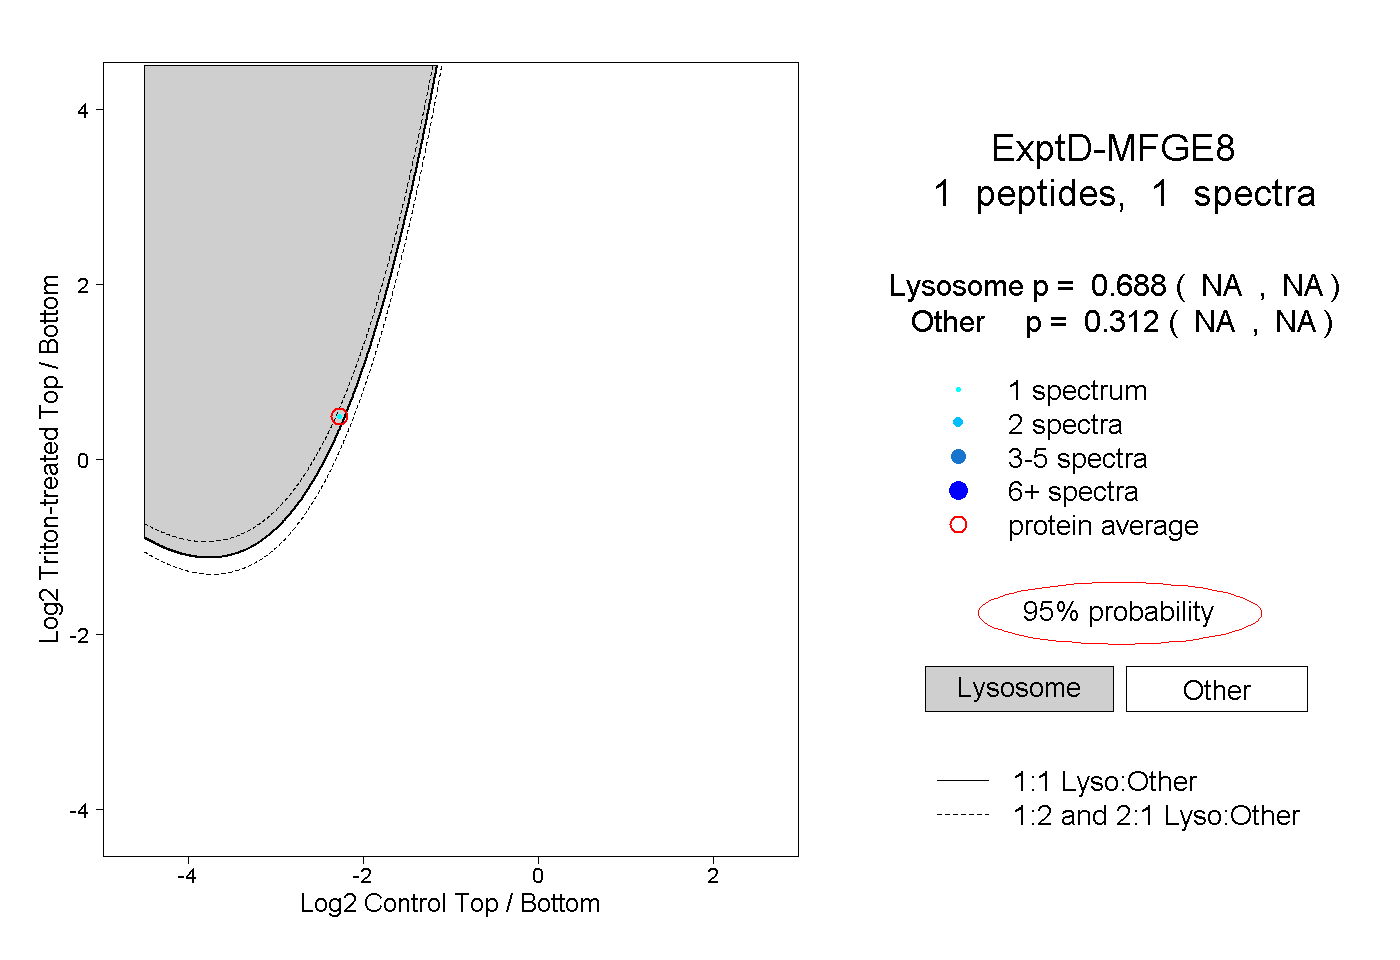
NA | NA
NA | NA