 11
11peptides
spectra
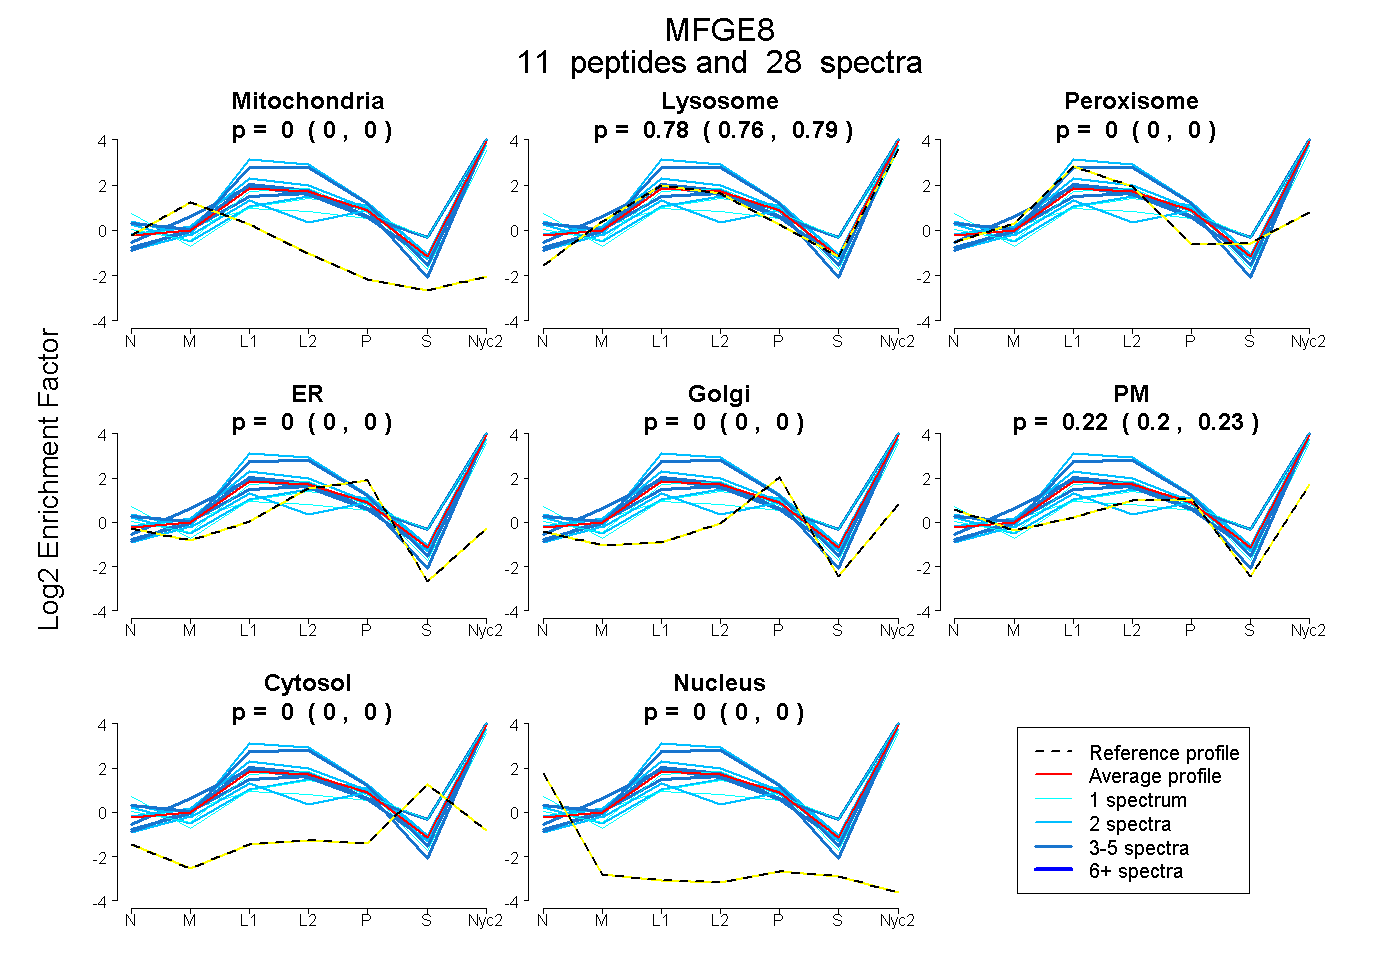
0.000 | 0.000
0.765 | 0.792
0.000 | 0.000
0.000 | 0.000
0.000 | 0.000
0.205 | 0.233
0.000 | 0.000
0.000 | 0.000
| Plot | Mito | Lyso | Perox | ER | Golgi | PM | Cytosol | Nucleus | |||||
| Expt A |
11 peptides |
28 spectra |
|
0.000 0.000 | 0.000 |
0.780 0.765 | 0.792 |
0.000 0.000 | 0.000 |
0.000 0.000 | 0.000 |
0.000 0.000 | 0.000 |
0.220 0.205 | 0.233 |
0.000 0.000 | 0.000 |
0.000 0.000 | 0.000 |
| 1 spectrum, WGPELAR | 0.000 | 0.809 | 0.000 | 0.000 | 0.000 | 0.191 | 0.000 | 0.000 | ||
| 2 spectra, VAYSLDGR | 0.000 | 0.848 | 0.000 | 0.000 | 0.000 | 0.152 | 0.000 | 0.000 | ||
| 5 spectra, VSGVMTQGASR | 0.000 | 0.982 | 0.000 | 0.004 | 0.000 | 0.015 | 0.000 | 0.000 | ||
| 3 spectra, INMFNPTLEAQYIR | 0.000 | 0.887 | 0.000 | 0.000 | 0.000 | 0.113 | 0.000 | 0.000 | ||
| 2 spectra, AFGWYPHLGR | 0.000 | 0.560 | 0.000 | 0.000 | 0.000 | 0.440 | 0.000 | 0.000 | ||
| 1 spectrum, DFGHIQYVASYK | 0.000 | 0.707 | 0.000 | 0.000 | 0.000 | 0.209 | 0.083 | 0.000 | ||
| 4 spectra, VTGIITQGAR | 0.000 | 0.592 | 0.000 | 0.000 | 0.000 | 0.408 | 0.000 | 0.000 | ||
| 2 spectra, VLPLSWHNR | 0.000 | 0.568 | 0.000 | 0.000 | 0.000 | 0.432 | 0.000 | 0.000 | ||
| 1 spectrum, CLVTEDTQR | 0.000 | 0.378 | 0.000 | 0.000 | 0.000 | 0.622 | 0.000 | 0.000 | ||
| 2 spectra, INAWTAQSNSAK | 0.000 | 0.998 | 0.002 | 0.000 | 0.000 | 0.000 | 0.000 | 0.000 | ||
| 5 spectra, NIFEKPFMAR | 0.000 | 1.000 | 0.000 | 0.000 | 0.000 | 0.000 | 0.000 | 0.000 |
| Plot | Mito | Lyso or Perox | ER | Golgi | PM | Cytosol | Nucleus | ||||||
| Expt B |
1 peptide |
2 spectra |
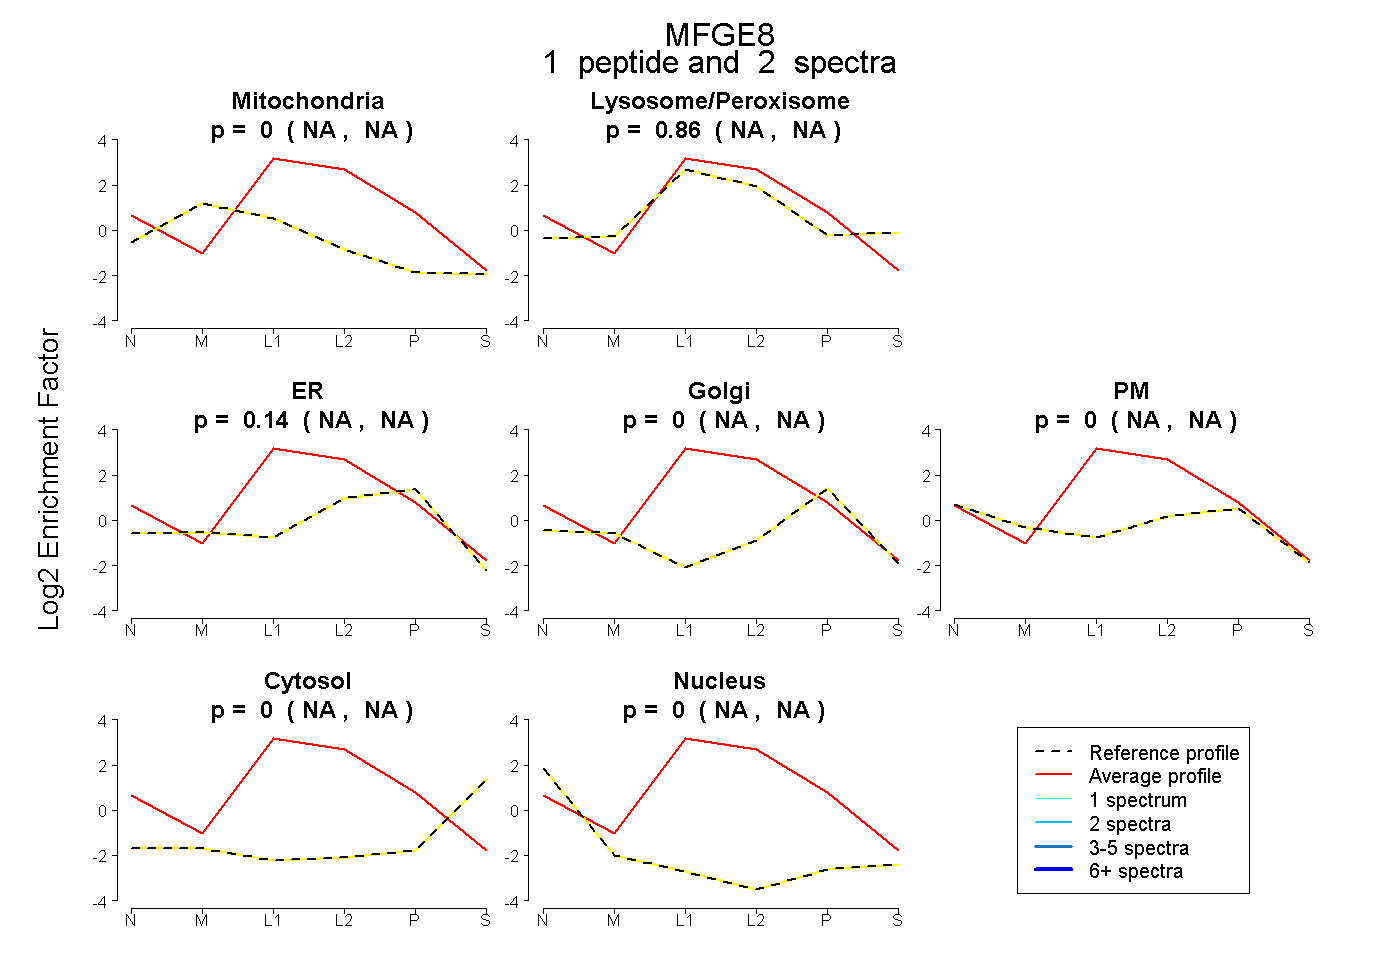 |
0.000 NA | NA |
0.864 NA | NA |
0.136 NA | NA |
0.000 NA | NA |
0.000 NA | NA |
0.000 NA | NA |
0.000 NA | NA |
|||
| Plot | Lyso | Other | |||||||||||
| Expt C |
14 peptides |
63 spectra |
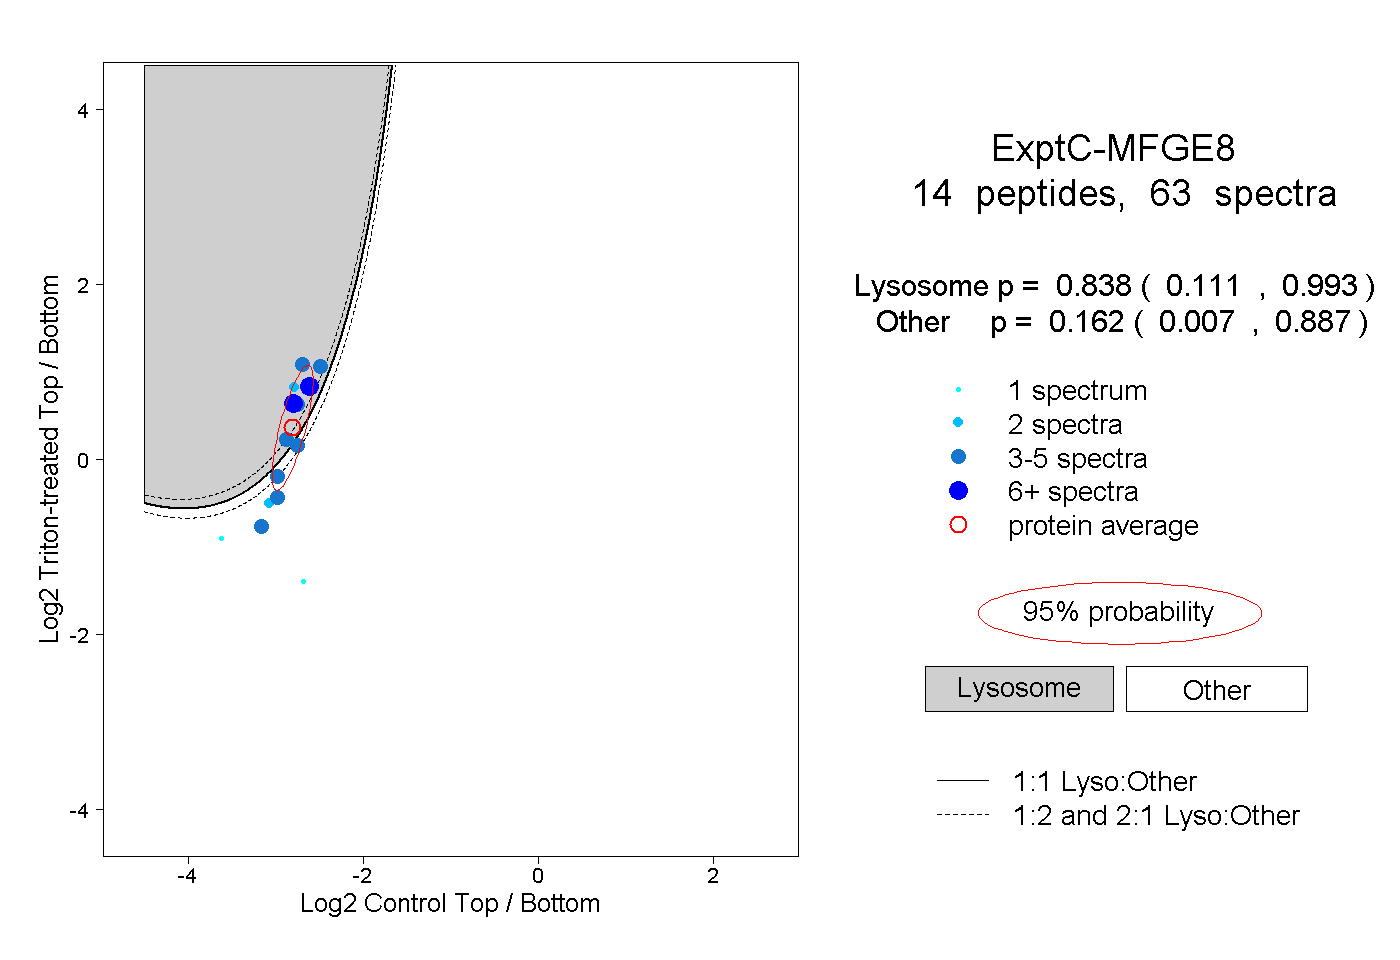 |
0.838 0.111 | 0.993 |
0.162 0.007 | 0.887 |
||||||||
| Plot | Lyso | Other | |||||||||||
| Expt D |
1 peptide |
1 spectrum |
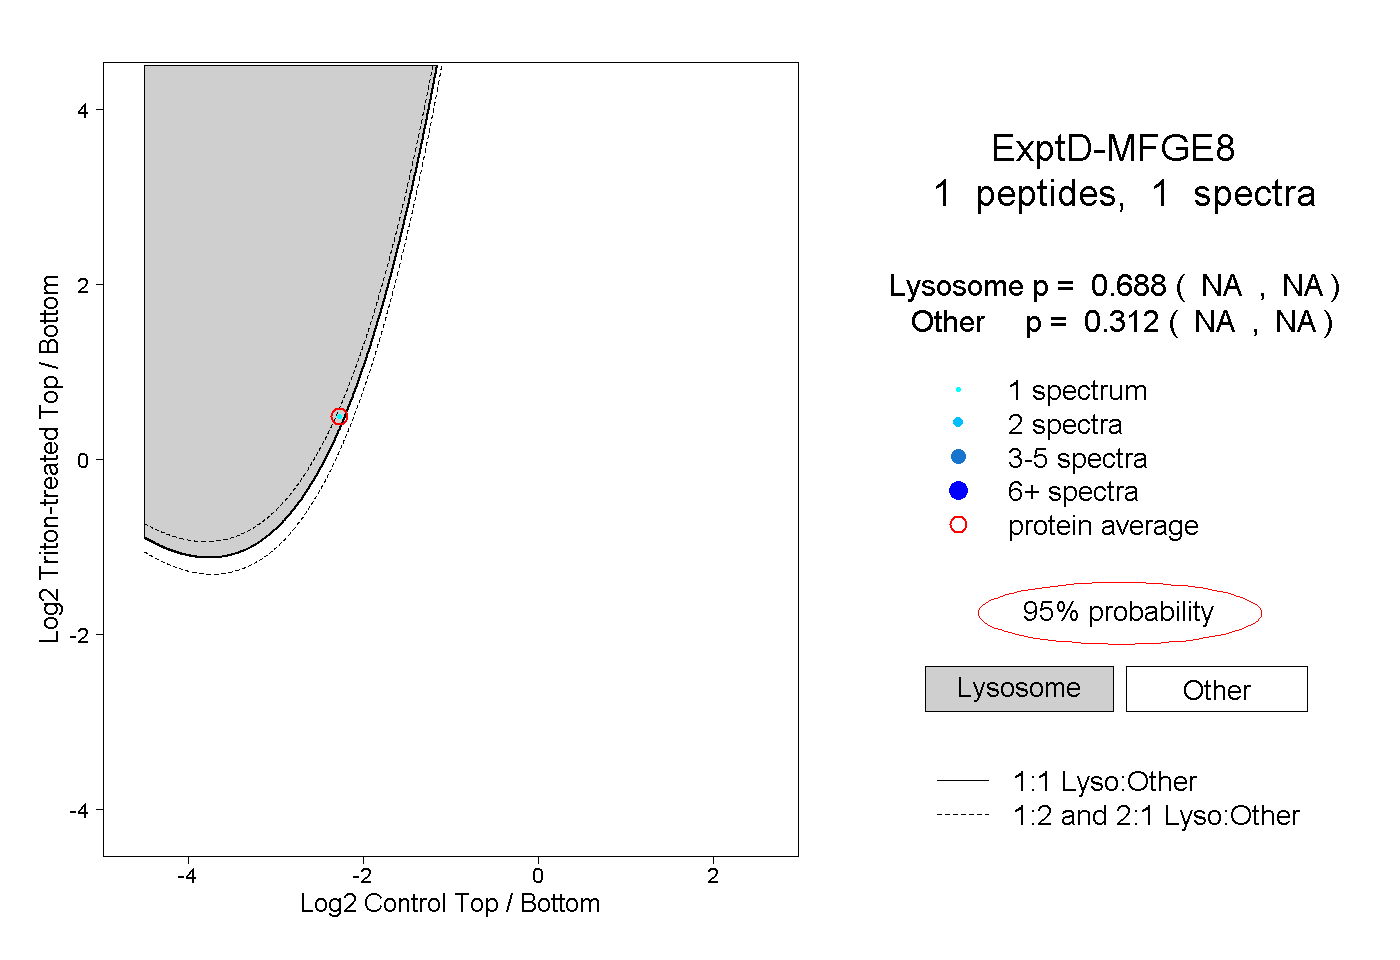 |
0.688 NA | NA |
0.312 NA | NA |