 7
7peptides
spectra
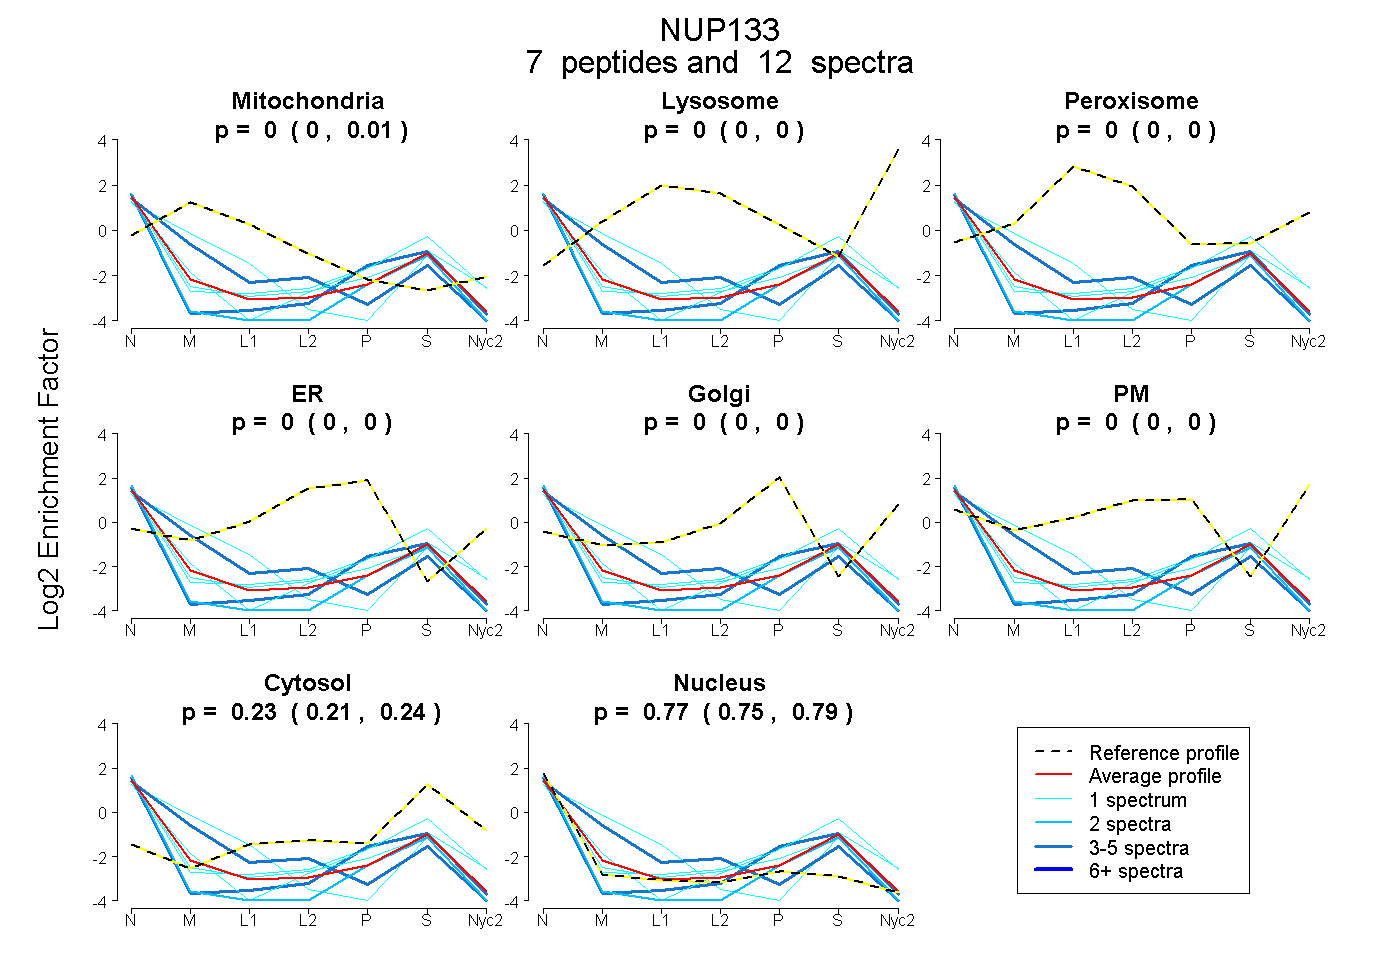
0.000 | 0.010
0.000 | 0.000
0.000 | 0.000
0.000 | 0.000
0.000 | 0.000
0.000 | 0.000
0.207 | 0.241
0.752 | 0.788
3peptides
spectra
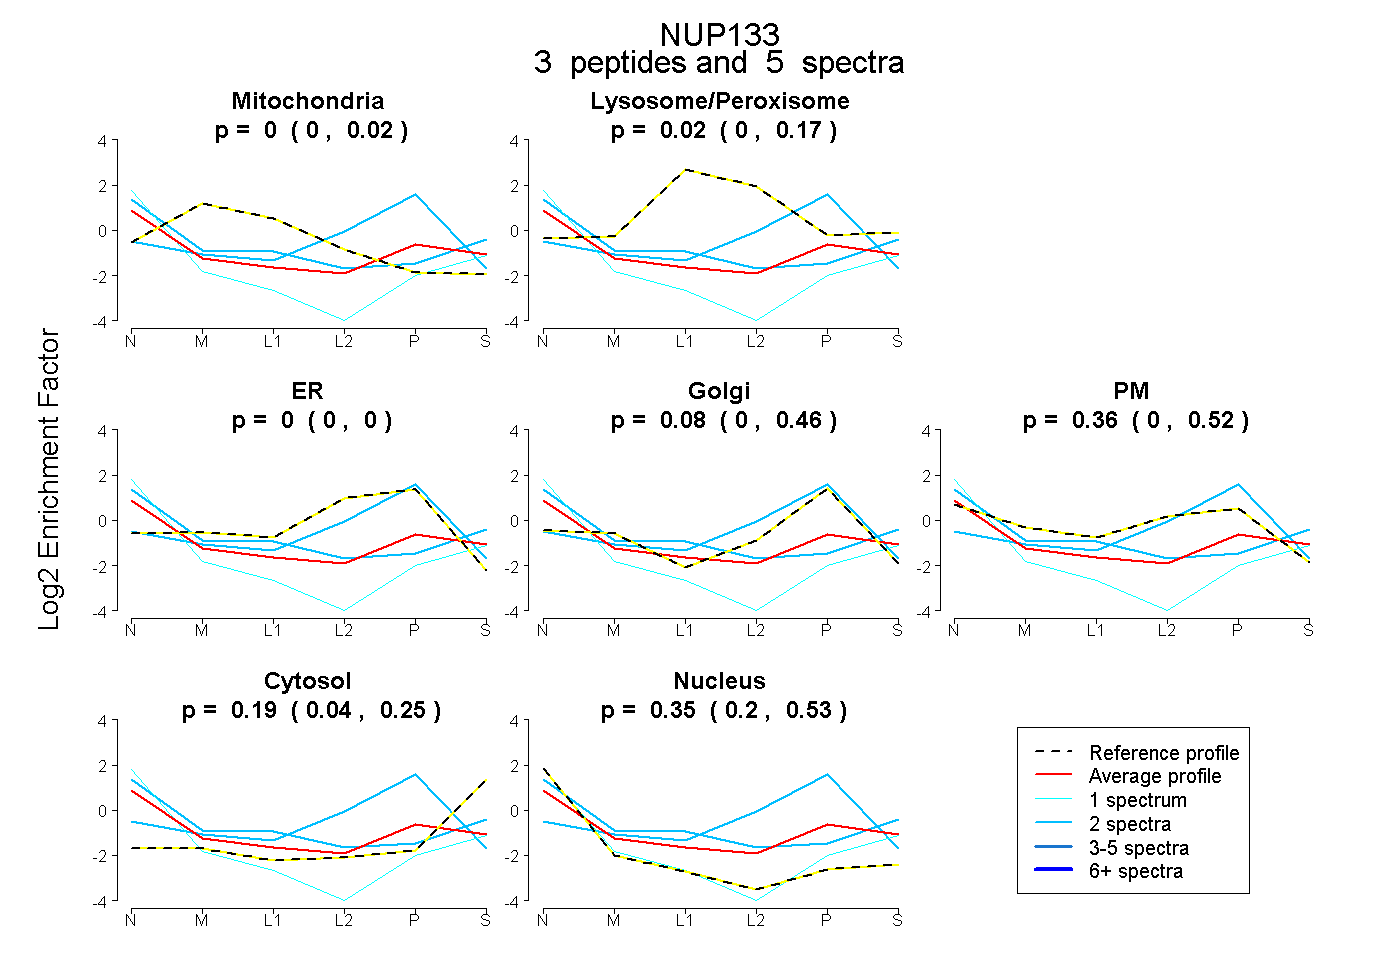
0.000 | 0.017
0.000 | 0.173
0.000 | 0.000
0.000 | 0.456
0.000 | 0.518
0.042 | 0.254
0.197 | 0.532
2peptides
spectra
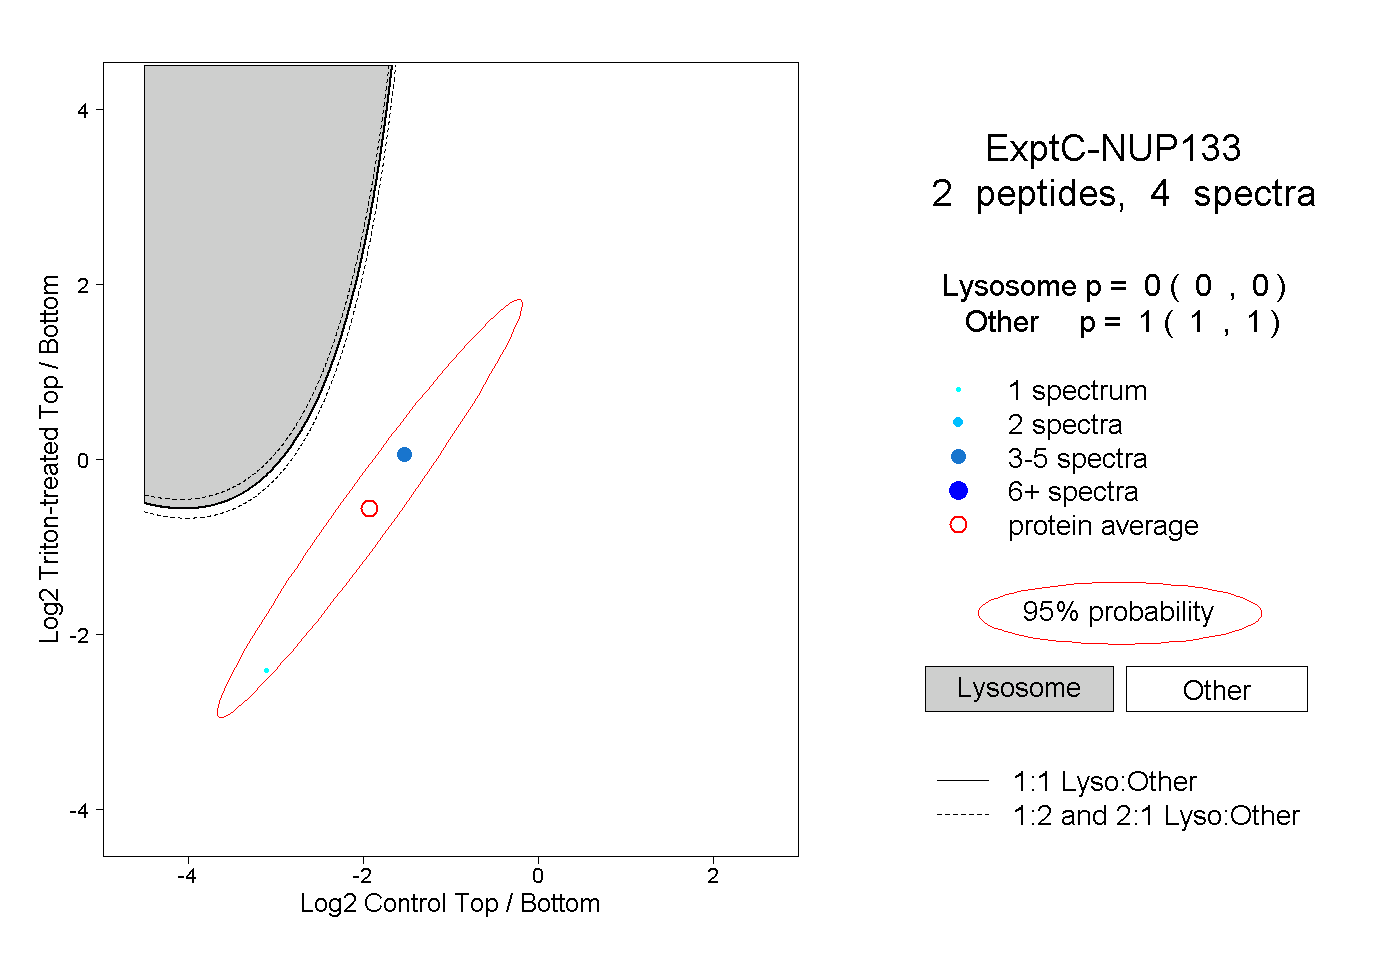
0.000 | 0.000
1.000 | 1.000