 7
7peptides
spectra
0.000 | 0.010
0.000 | 0.000
0.000 | 0.000
0.000 | 0.000
0.000 | 0.000
0.000 | 0.000
0.207 | 0.241
0.752 | 0.788
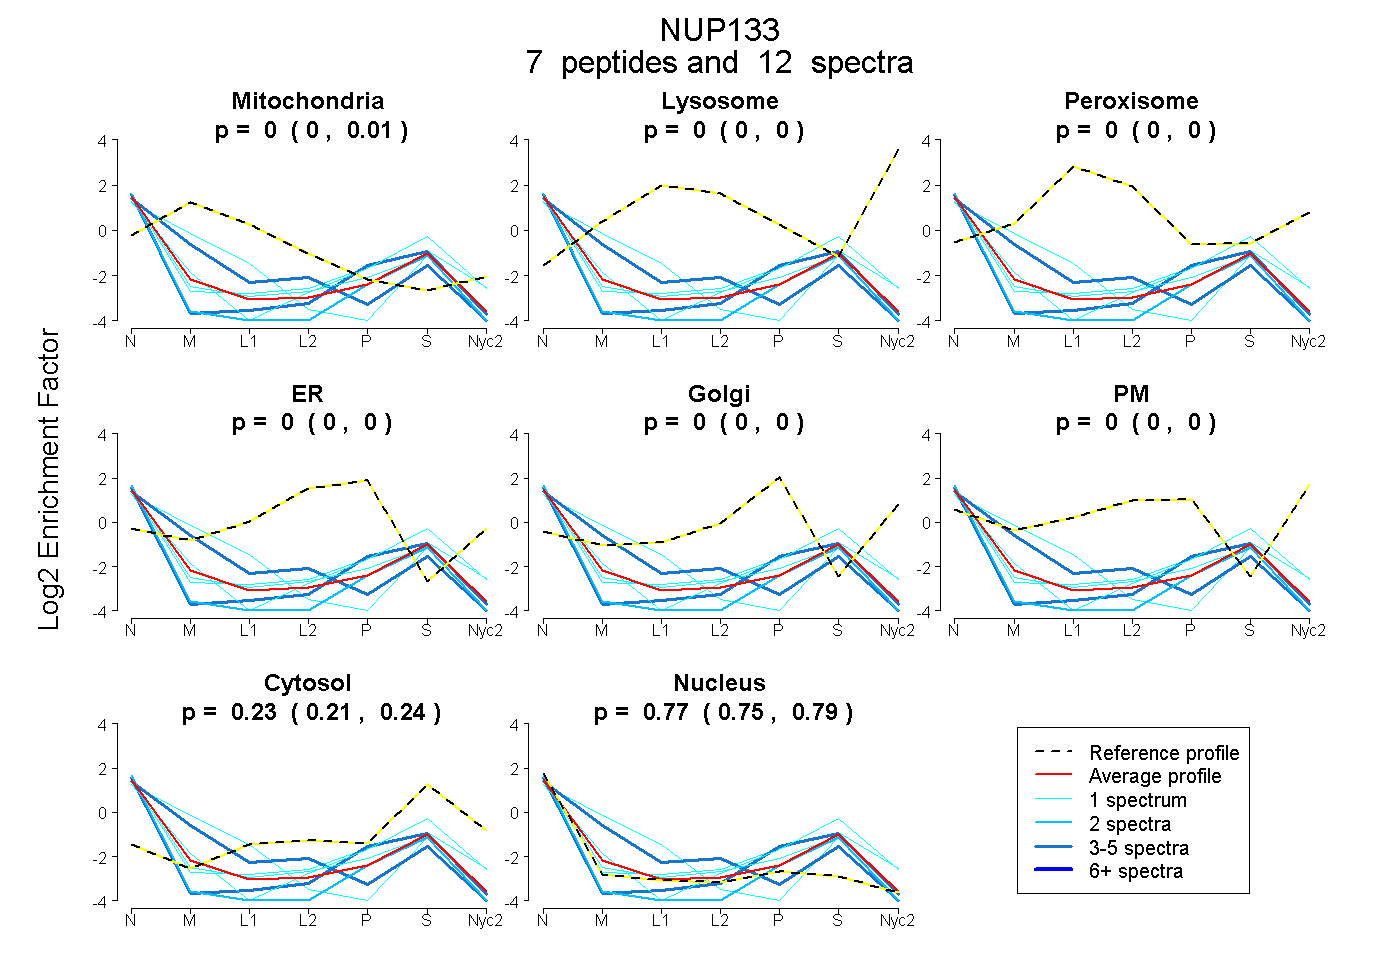
| Plot | Mito | Lyso | Perox | ER | Golgi | PM | Cytosol | Nucleus | |||||
| Expt A |
7 peptides |
12 spectra |
|
0.000 0.000 | 0.010 |
0.000 0.000 | 0.000 |
0.000 0.000 | 0.000 |
0.000 0.000 | 0.000 |
0.000 0.000 | 0.000 |
0.000 0.000 | 0.000 |
0.227 0.207 | 0.241 |
0.773 0.752 | 0.788 |
| 3 spectra, GTPMTTR | 0.000 | 0.000 | 0.000 | 0.000 | 0.000 | 0.000 | 0.201 | 0.799 | ||
| 1 spectrum, DLLQAEQLGSLK | 0.404 | 0.000 | 0.000 | 0.000 | 0.000 | 0.000 | 0.000 | 0.596 | ||
| 1 spectrum, LLLCEHAEK | 0.000 | 0.000 | 0.000 | 0.000 | 0.000 | 0.000 | 0.205 | 0.795 | ||
| 1 spectrum, DGVQLSEYLPEVK | 0.000 | 0.000 | 0.000 | 0.000 | 0.025 | 0.000 | 0.324 | 0.651 | ||
| 2 spectra, TVYPQADSNLR | 0.000 | 0.000 | 0.000 | 0.000 | 0.000 | 0.000 | 0.086 | 0.914 | ||
| 1 spectrum, TLLGLSK | 0.000 | 0.000 | 0.000 | 0.000 | 0.000 | 0.000 | 0.373 | 0.627 | ||
| 3 spectra, FLLHQETLPEQLLTER | 0.348 | 0.000 | 0.000 | 0.000 | 0.000 | 0.000 | 0.020 | 0.632 |
| Plot | Mito | Lyso or Perox | ER | Golgi | PM | Cytosol | Nucleus | ||||||
| Expt B |
3 peptides |
5 spectra |
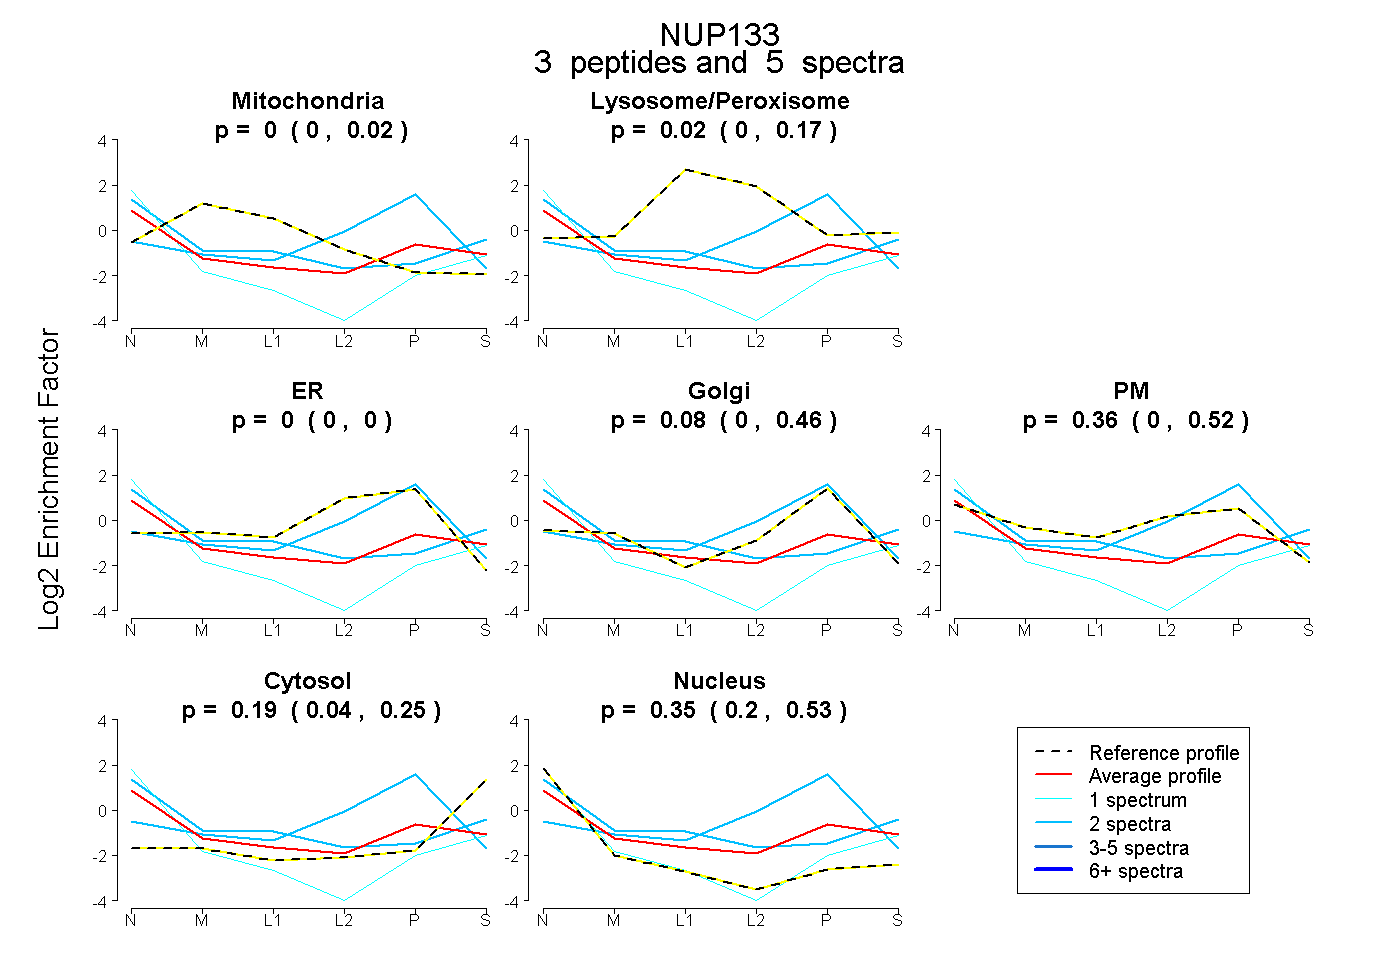 |
0.000 0.000 | 0.017 |
0.017 0.000 | 0.173 |
0.000 0.000 | 0.000 |
0.079 0.000 | 0.456 |
0.358 0.000 | 0.518 |
0.191 0.042 | 0.254 |
0.355 0.197 | 0.532 |
|||
| Plot | Lyso | Other | |||||||||||
| Expt C |
2 peptides |
4 spectra |
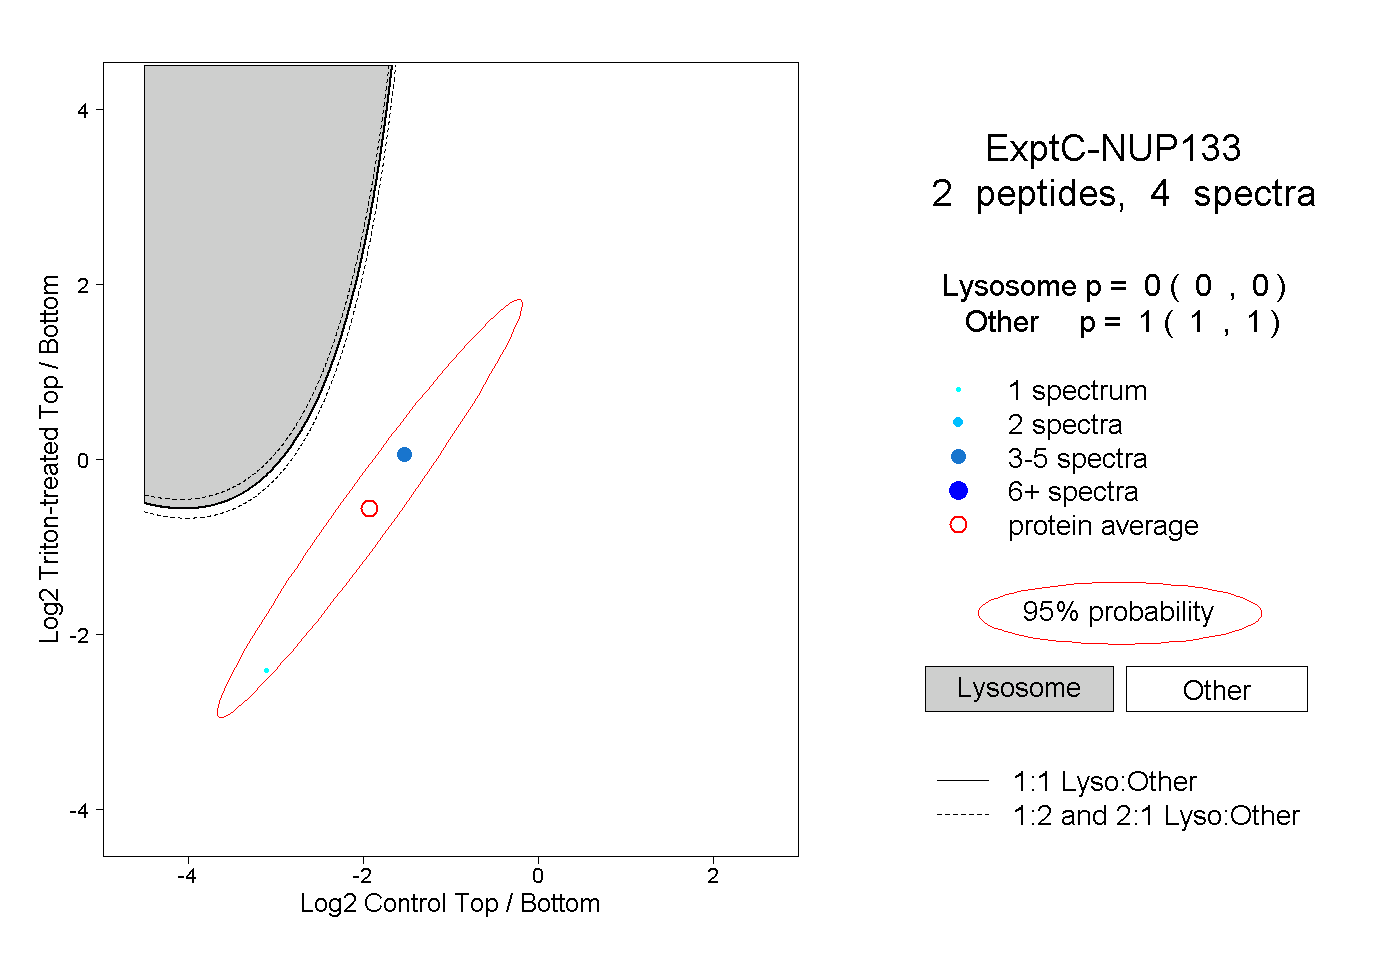 |
0.000 0.000 | 0.000 |
1.000 1.000 | 1.000 |