 11
11peptides
spectra
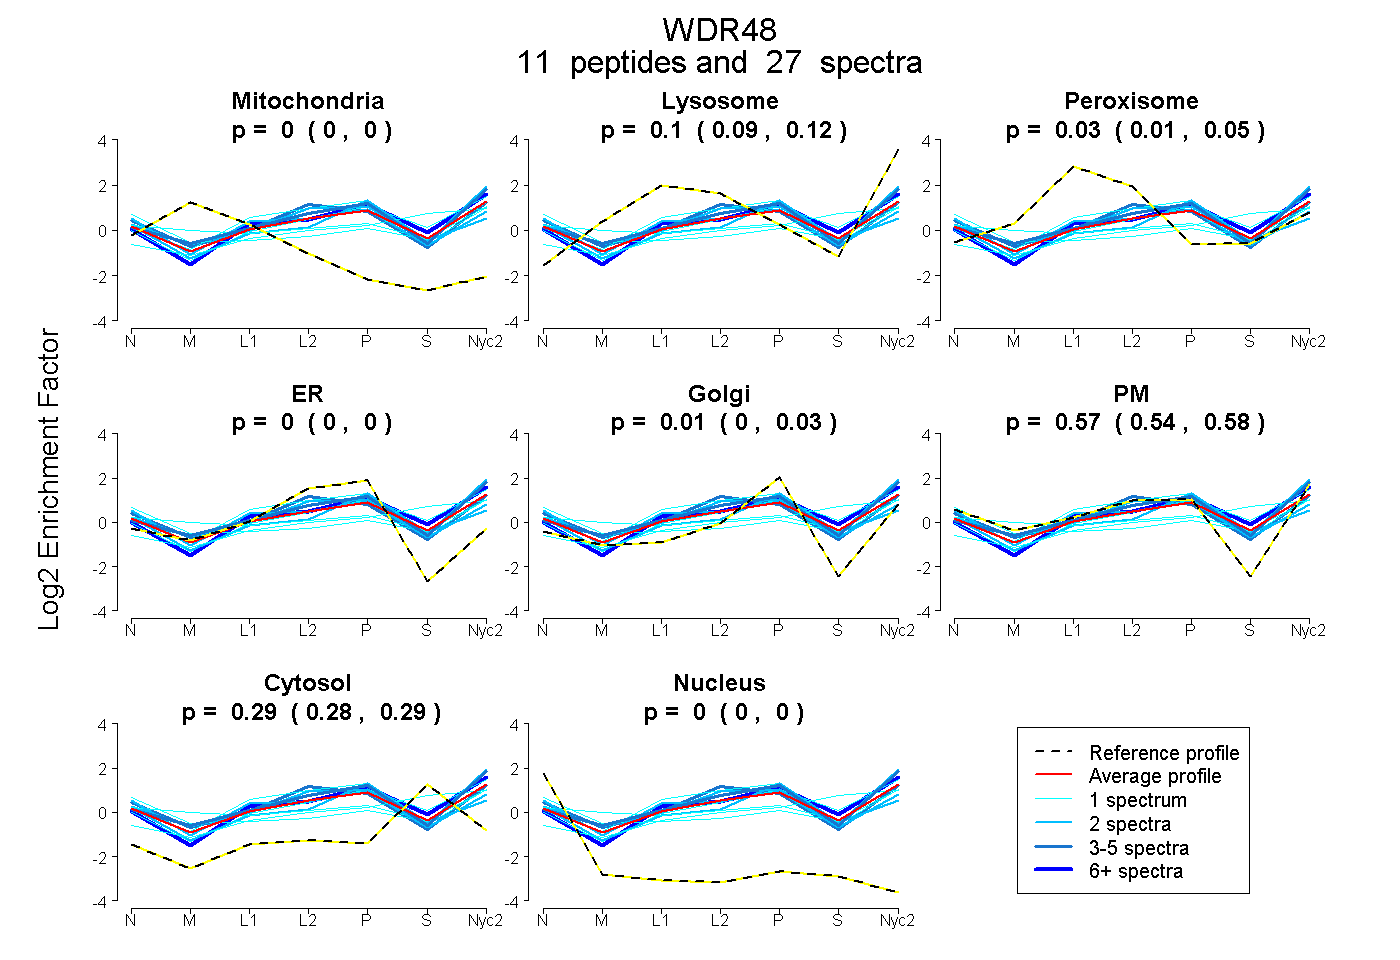
0.000 | 0.000
0.088 | 0.120
0.013 | 0.048
0.000 | 0.000
0.000 | 0.034
0.537 | 0.584
0.277 | 0.294
0.000 | 0.000
2peptides
spectra
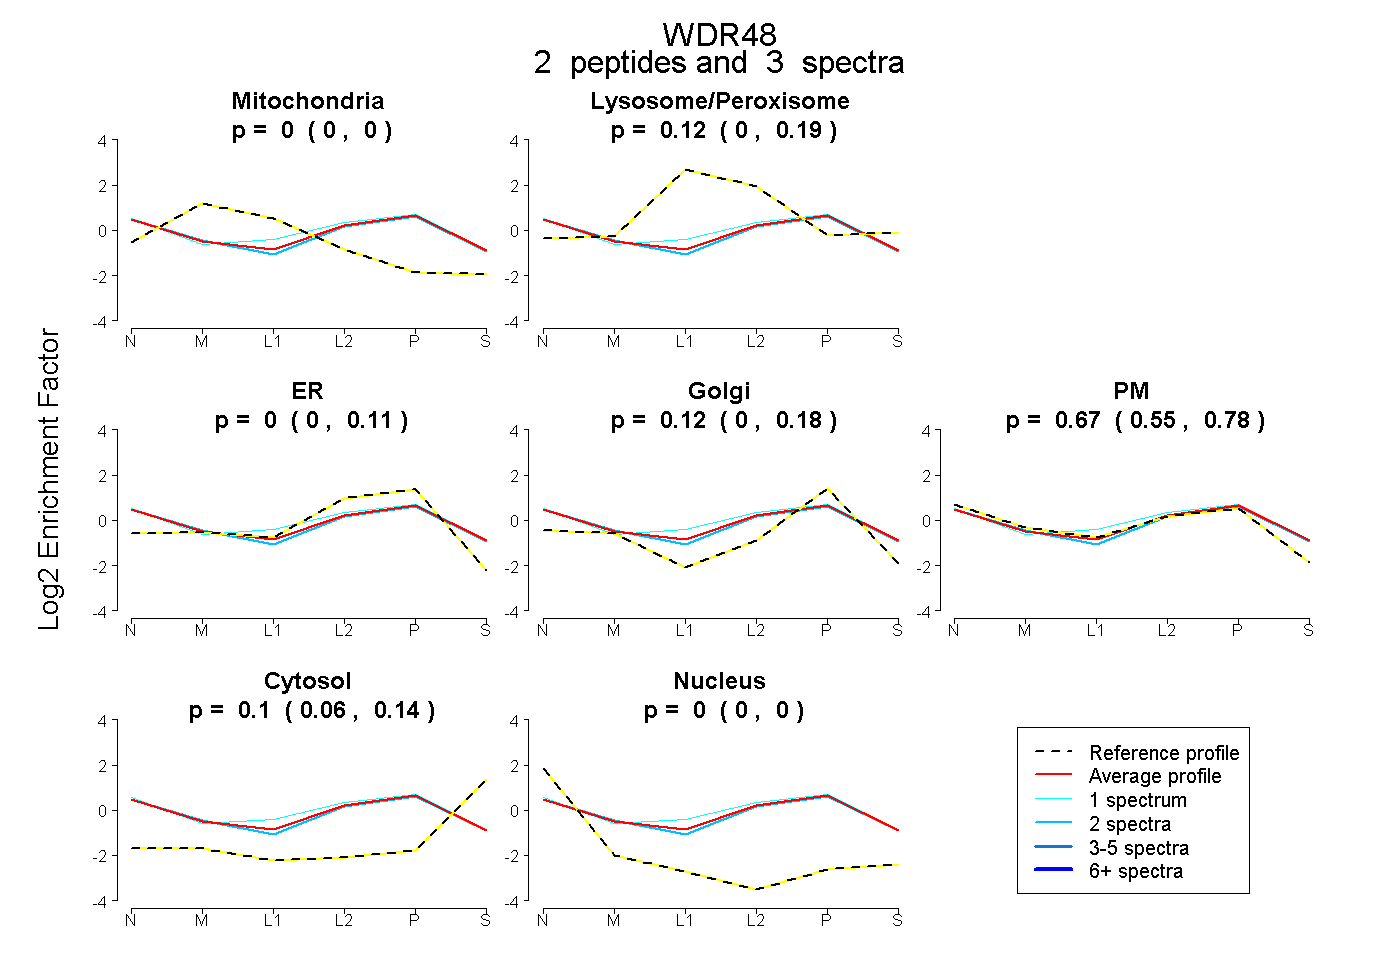
0.000 | 0.000
0.000 | 0.190
0.000 | 0.115
0.000 | 0.180
0.549 | 0.778
0.063 | 0.142
0.000 | 0.000
13peptides
spectra
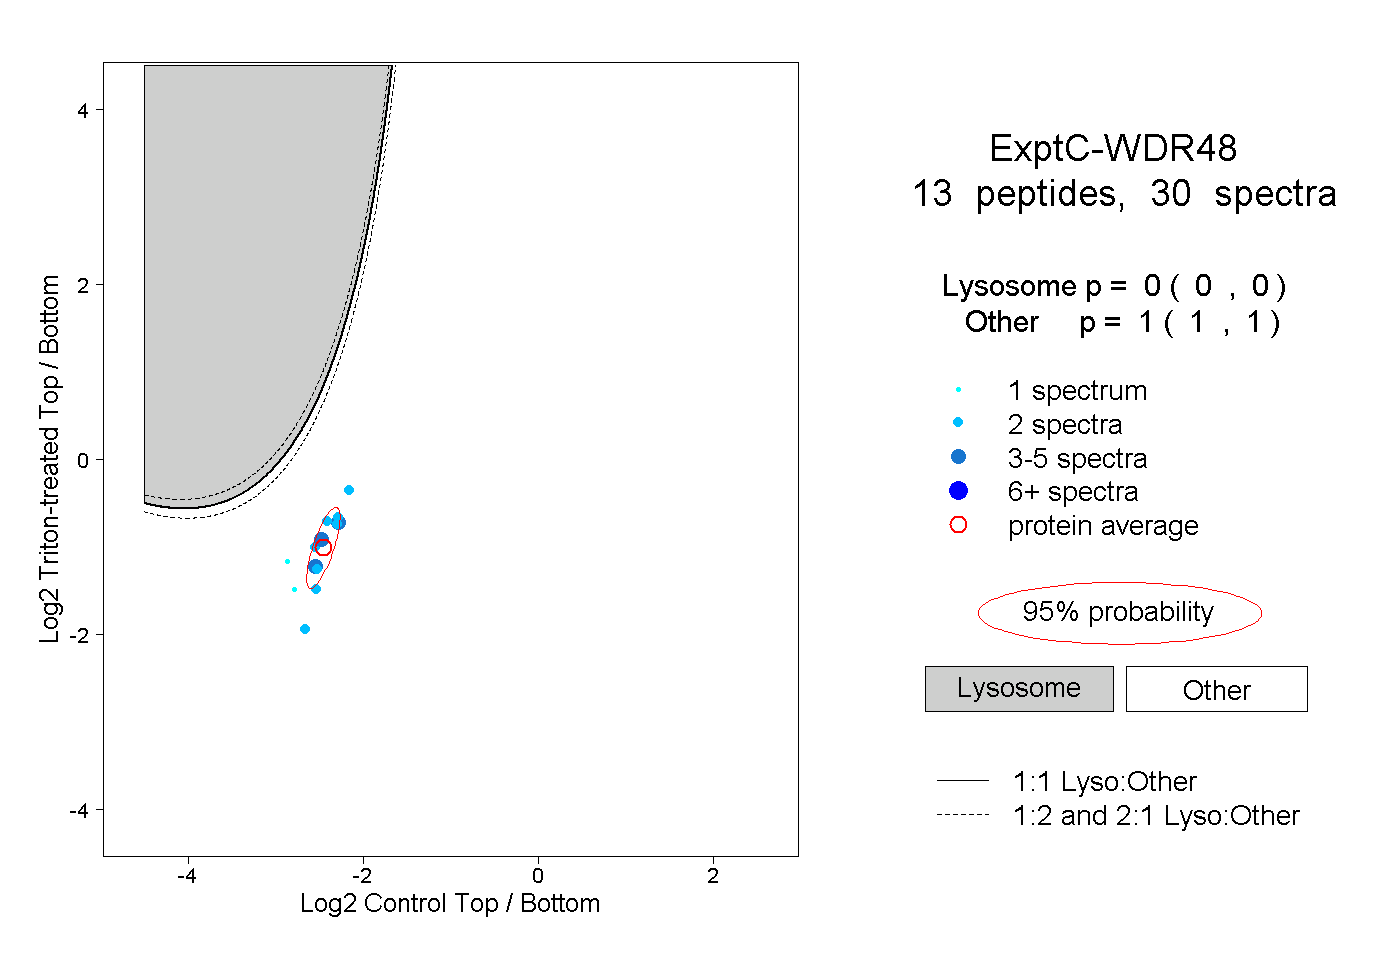
0.000 | 0.000
1.000 | 1.000
1peptide
spectra
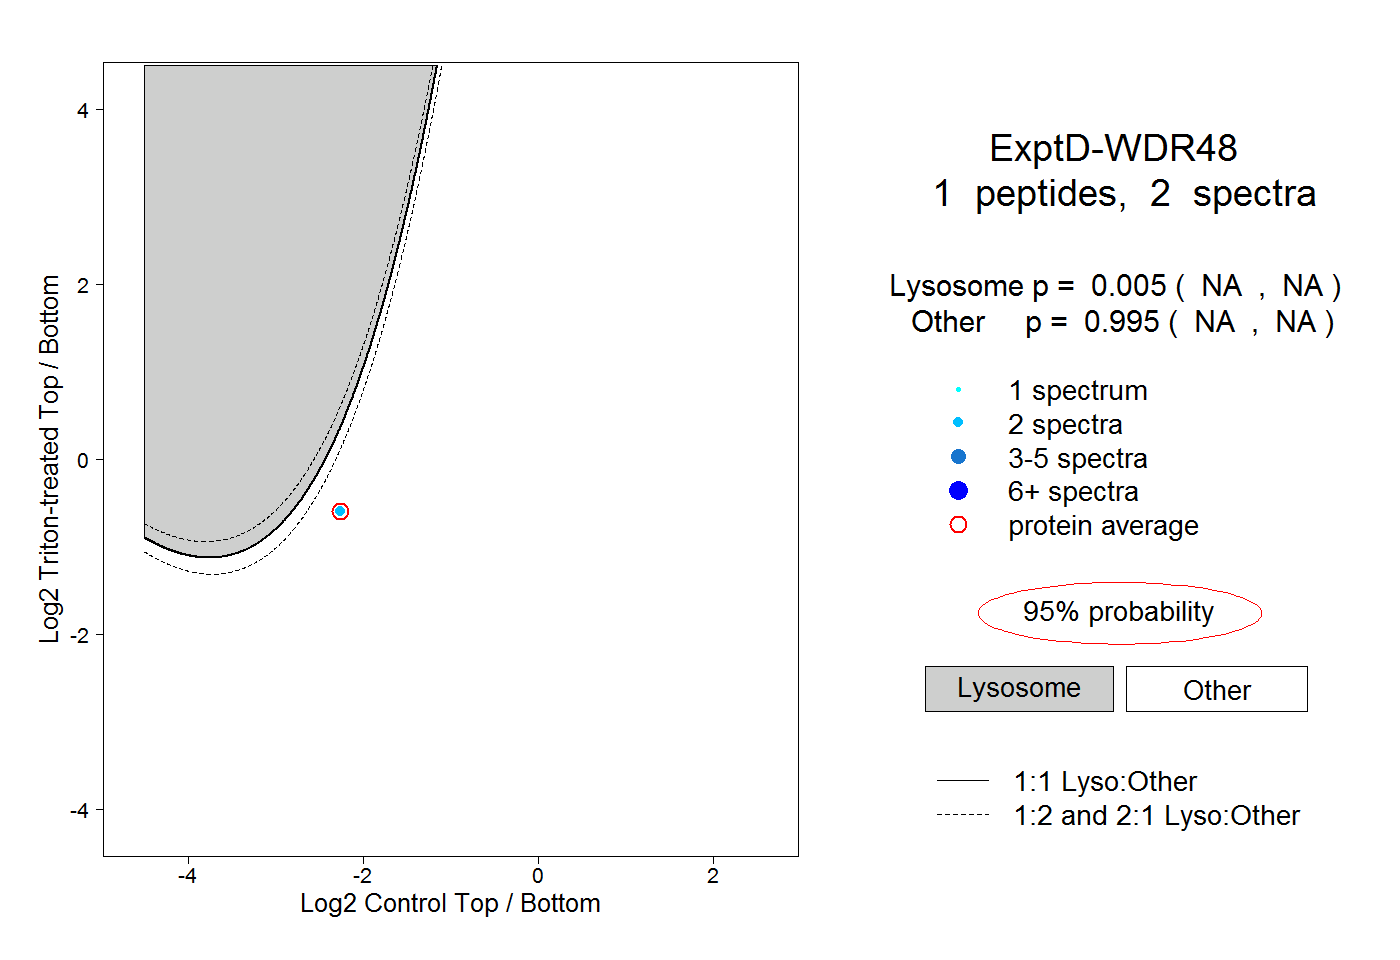
NA | NA
NA | NA