 11
11peptides
spectra
0.000 | 0.000
0.088 | 0.120
0.013 | 0.048
0.000 | 0.000
0.000 | 0.034
0.537 | 0.584
0.277 | 0.294
0.000 | 0.000
| Plot | Mito | Lyso | Perox | ER | Golgi | PM | Cytosol | Nucleus | |||||
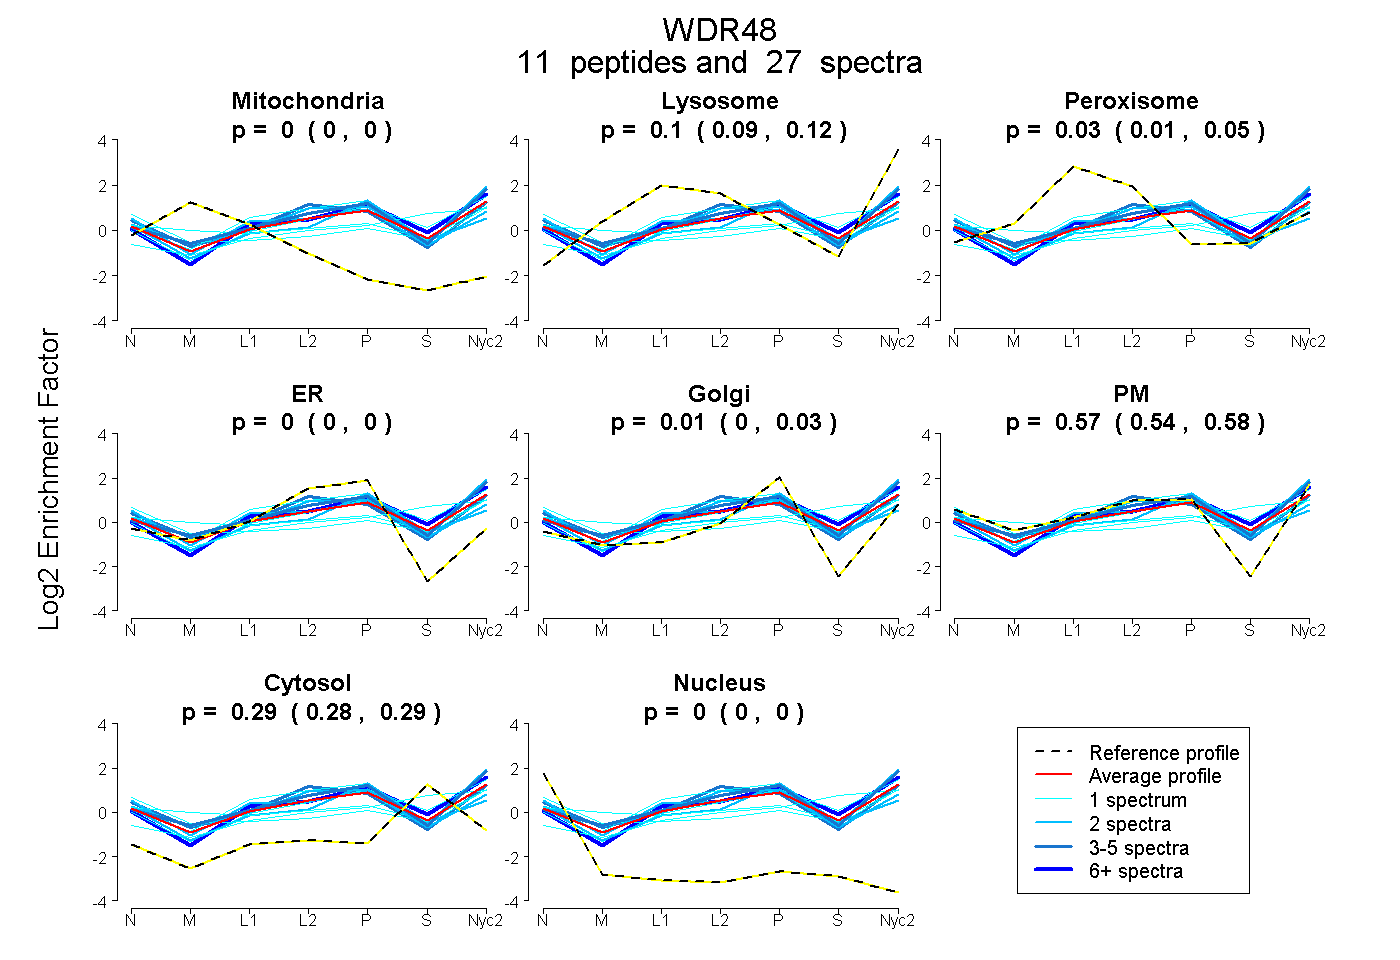
| Expt A |
11 peptides |
27 spectra |
|
0.000 0.000 | 0.000 |
0.104 0.088 | 0.120 |
0.031 0.013 | 0.048 |
0.000 0.000 | 0.000 |
0.008 0.000 | 0.034 |
0.569 0.537 | 0.584 |
0.287 0.277 | 0.294 |
0.000 0.000 | 0.000 |
| 3 spectra, VWNAHK | 0.000 | 0.229 | 0.000 | 0.000 | 0.087 | 0.504 | 0.181 | 0.000 | ||
| 2 spectra, LWSLGQQR | 0.000 | 0.210 | 0.000 | 0.000 | 0.000 | 0.598 | 0.192 | 0.000 | ||
| 1 spectrum, GFCMSTLR | 0.000 | 0.032 | 0.300 | 0.022 | 0.311 | 0.218 | 0.116 | 0.000 | ||
| 3 spectra, DGTQCLSGSSDGTIR | 0.000 | 0.000 | 0.135 | 0.005 | 0.000 | 0.675 | 0.185 | 0.000 | ||
| 1 spectrum, VQVSYVIR | 0.000 | 0.261 | 0.000 | 0.000 | 0.013 | 0.194 | 0.532 | 0.000 | ||
| 2 spectra, IWSVNQHK | 0.000 | 0.000 | 0.108 | 0.017 | 0.362 | 0.250 | 0.263 | 0.000 | ||
| 1 spectrum, NGVNALQLDPALNR | 0.036 | 0.079 | 0.078 | 0.000 | 0.000 | 0.515 | 0.292 | 0.000 | ||
| 1 spectrum, VDFEDEIK | 0.000 | 0.018 | 0.000 | 0.000 | 0.000 | 0.628 | 0.353 | 0.000 | ||
| 10 spectra, ALLLHR | 0.000 | 0.220 | 0.000 | 0.000 | 0.091 | 0.393 | 0.296 | 0.000 | ||
| 2 spectra, VLICEEK | 0.000 | 0.000 | 0.133 | 0.042 | 0.015 | 0.570 | 0.240 | 0.000 | ||
| 1 spectrum, GHTDNVK | 0.000 | 0.206 | 0.000 | 0.000 | 0.089 | 0.372 | 0.333 | 0.000 |
| Plot | Mito | Lyso or Perox | ER | Golgi | PM | Cytosol | Nucleus | ||||||
| Expt B |
2 peptides |
3 spectra |
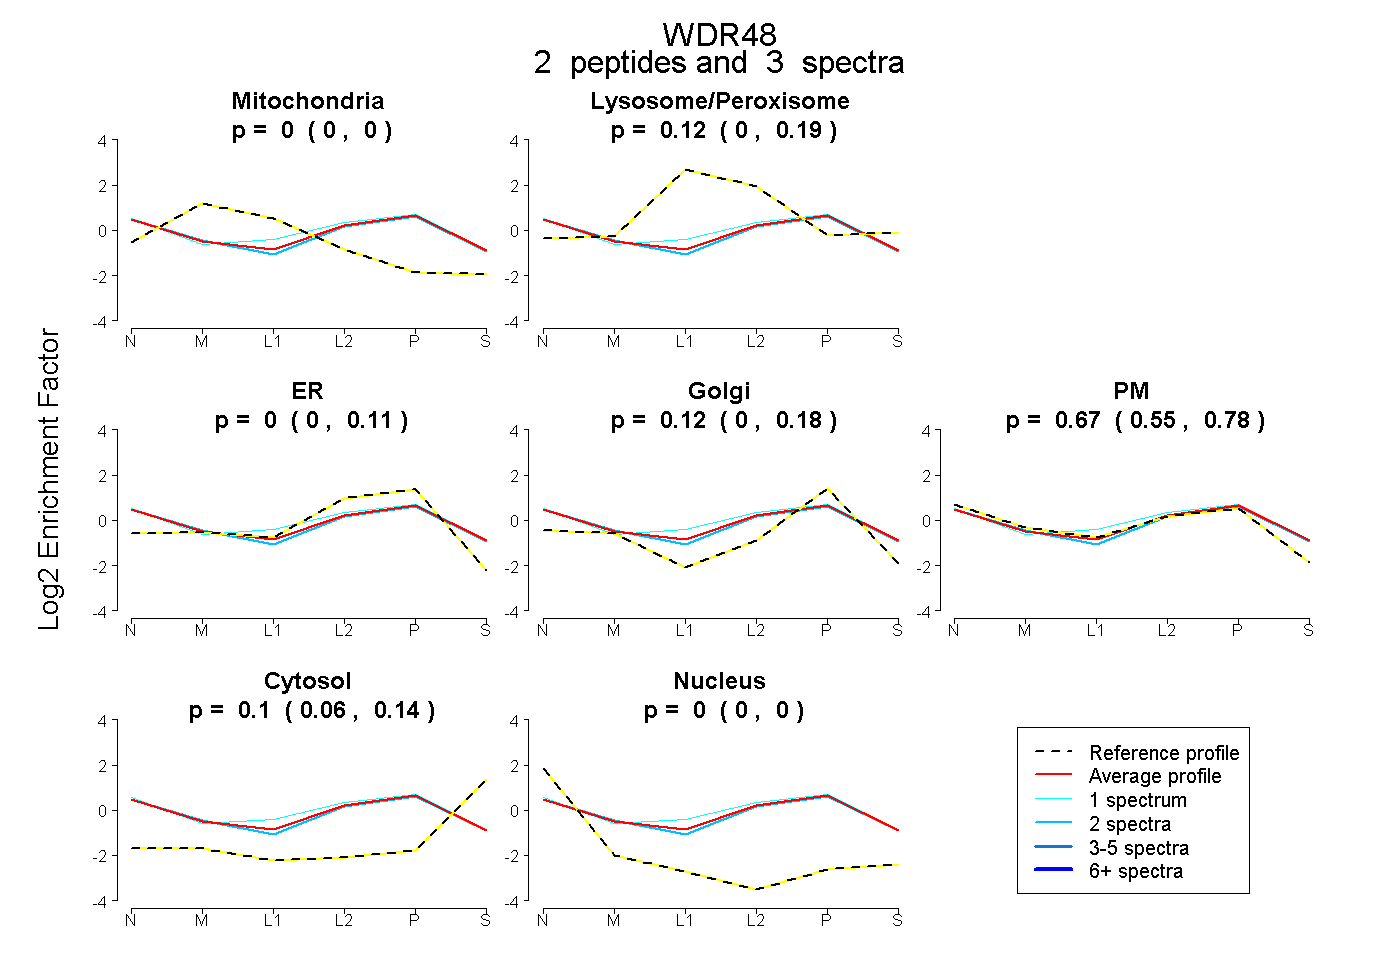 |
0.000 0.000 | 0.000 |
0.115 0.000 | 0.190 |
0.000 0.000 | 0.115 |
0.115 0.000 | 0.180 |
0.672 0.549 | 0.778 |
0.097 0.063 | 0.142 |
0.000 0.000 | 0.000 |
|||
| Plot | Lyso | Other | |||||||||||
| Expt C |
13 peptides |
30 spectra |
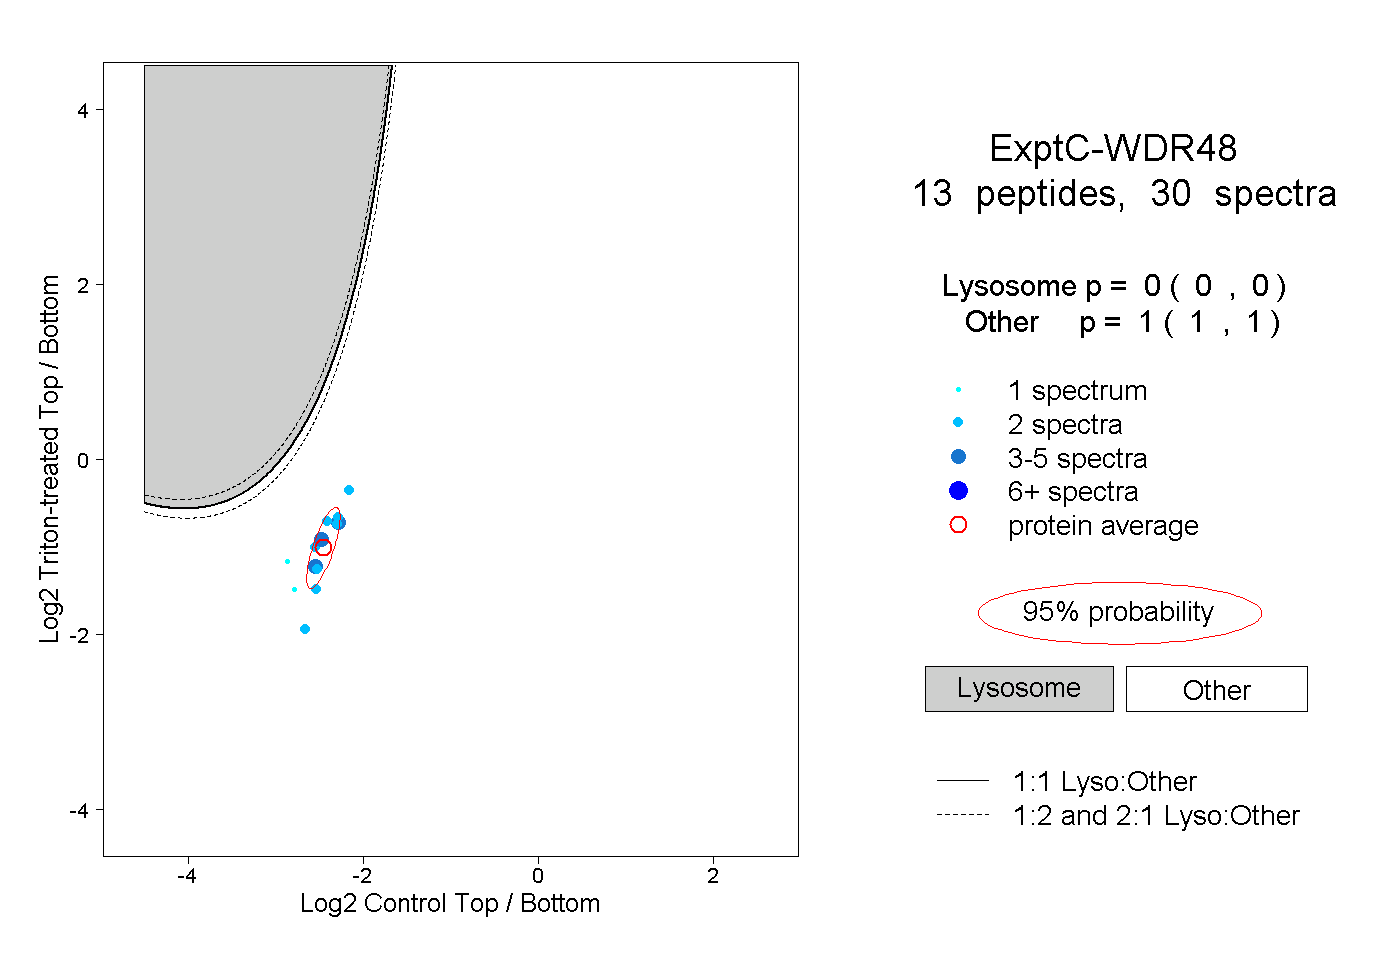 |
0.000 0.000 | 0.000 |
1.000 1.000 | 1.000 |
||||||||
| Plot | Lyso | Other | |||||||||||
| Expt D |
1 peptide |
2 spectra |
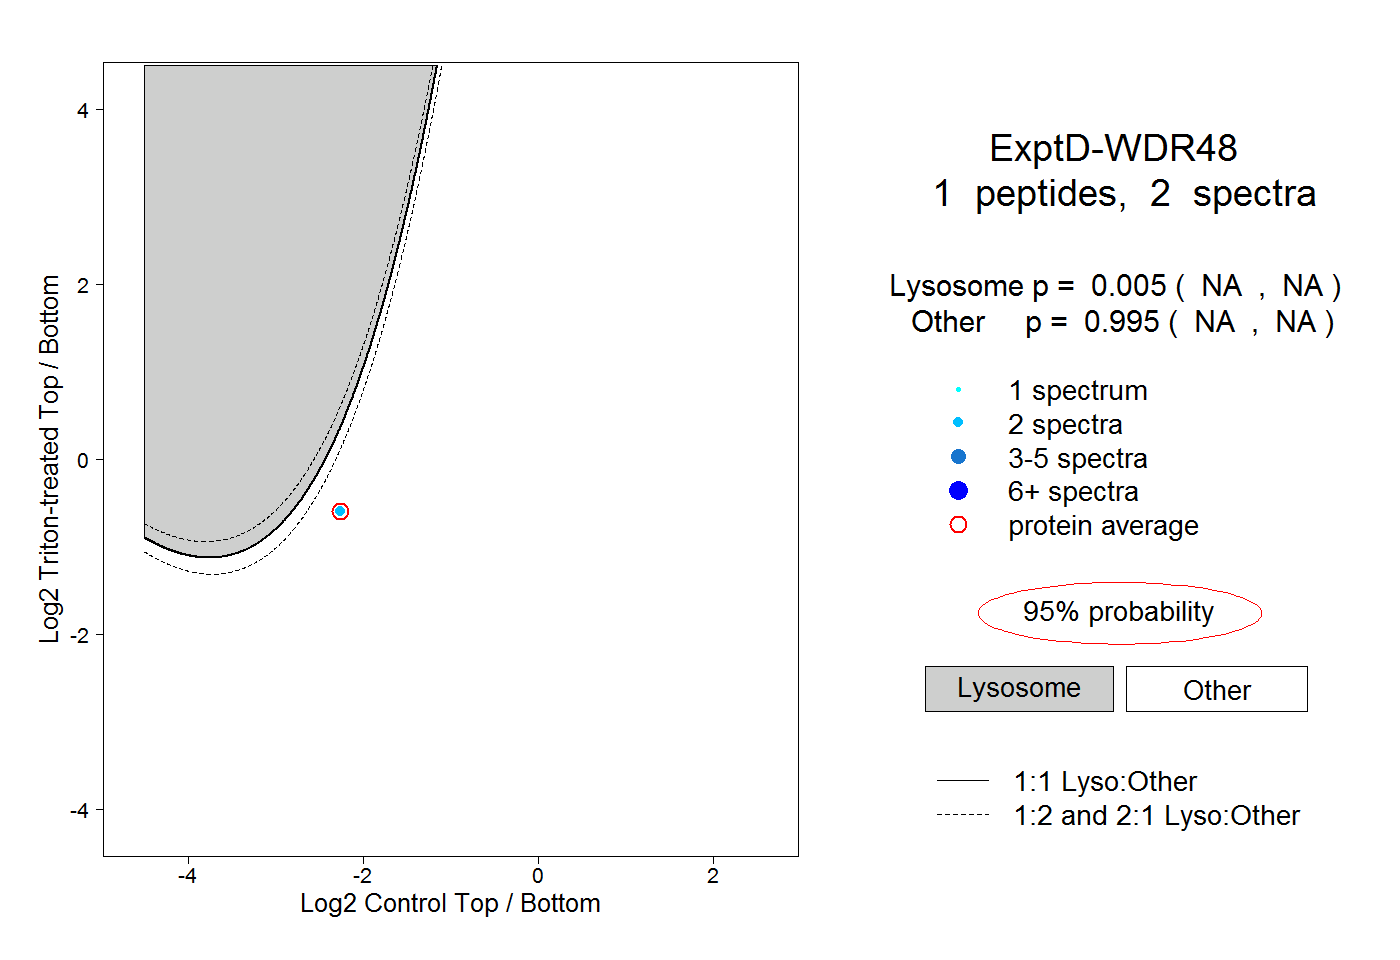 |
0.005 NA | NA |
0.995 NA | NA |