 12
12peptides
spectra
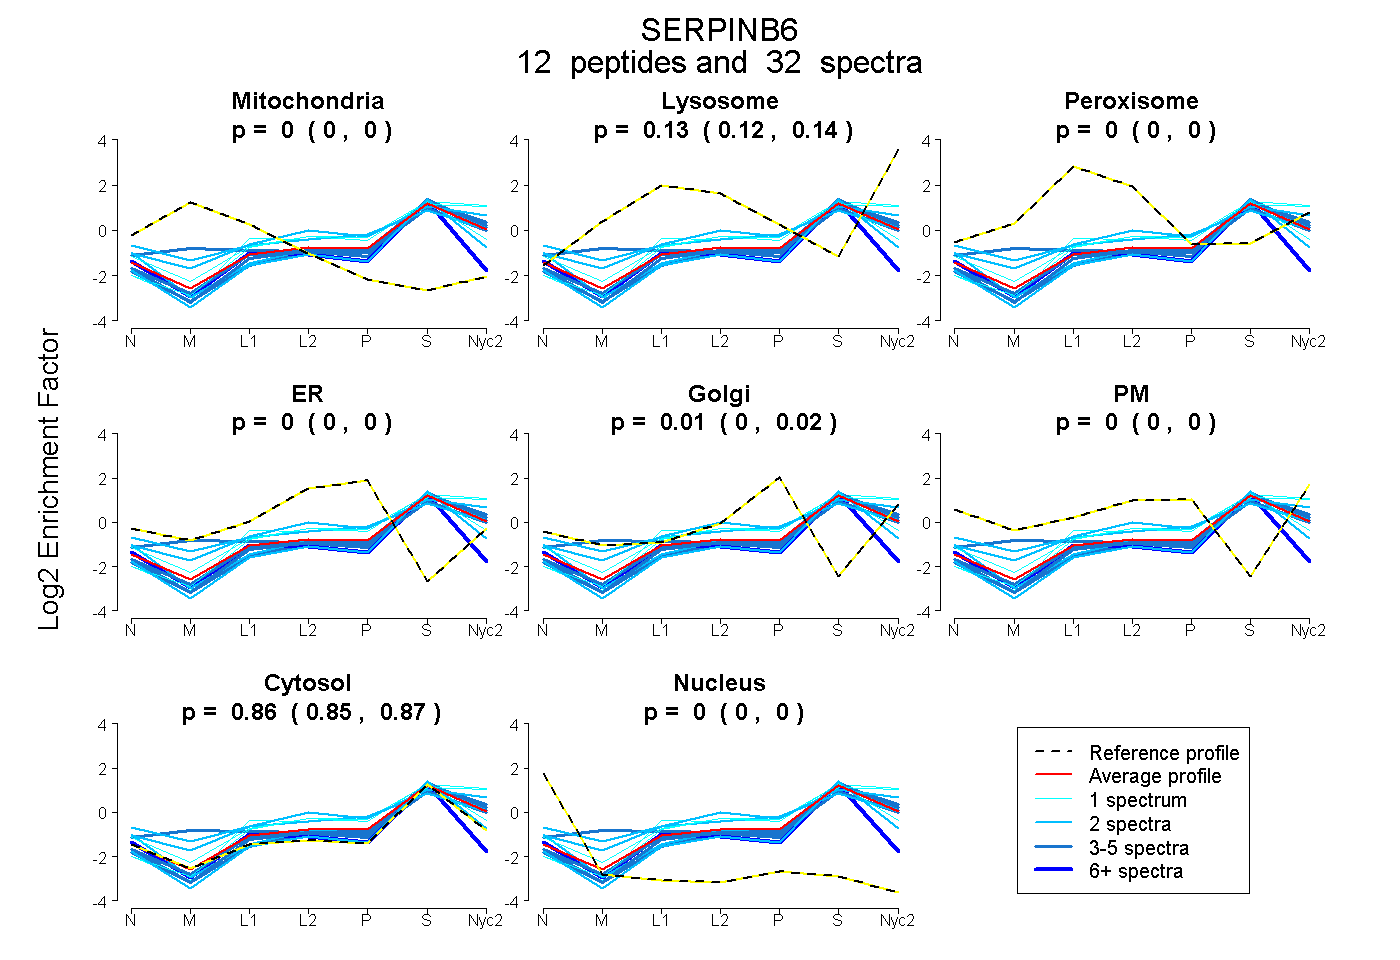
0.000 | 0.000
0.116 | 0.137
0.000 | 0.000
0.000 | 0.000
0.005 | 0.022
0.000 | 0.000
0.851 | 0.866
0.000 | 0.000
3peptides
spectra
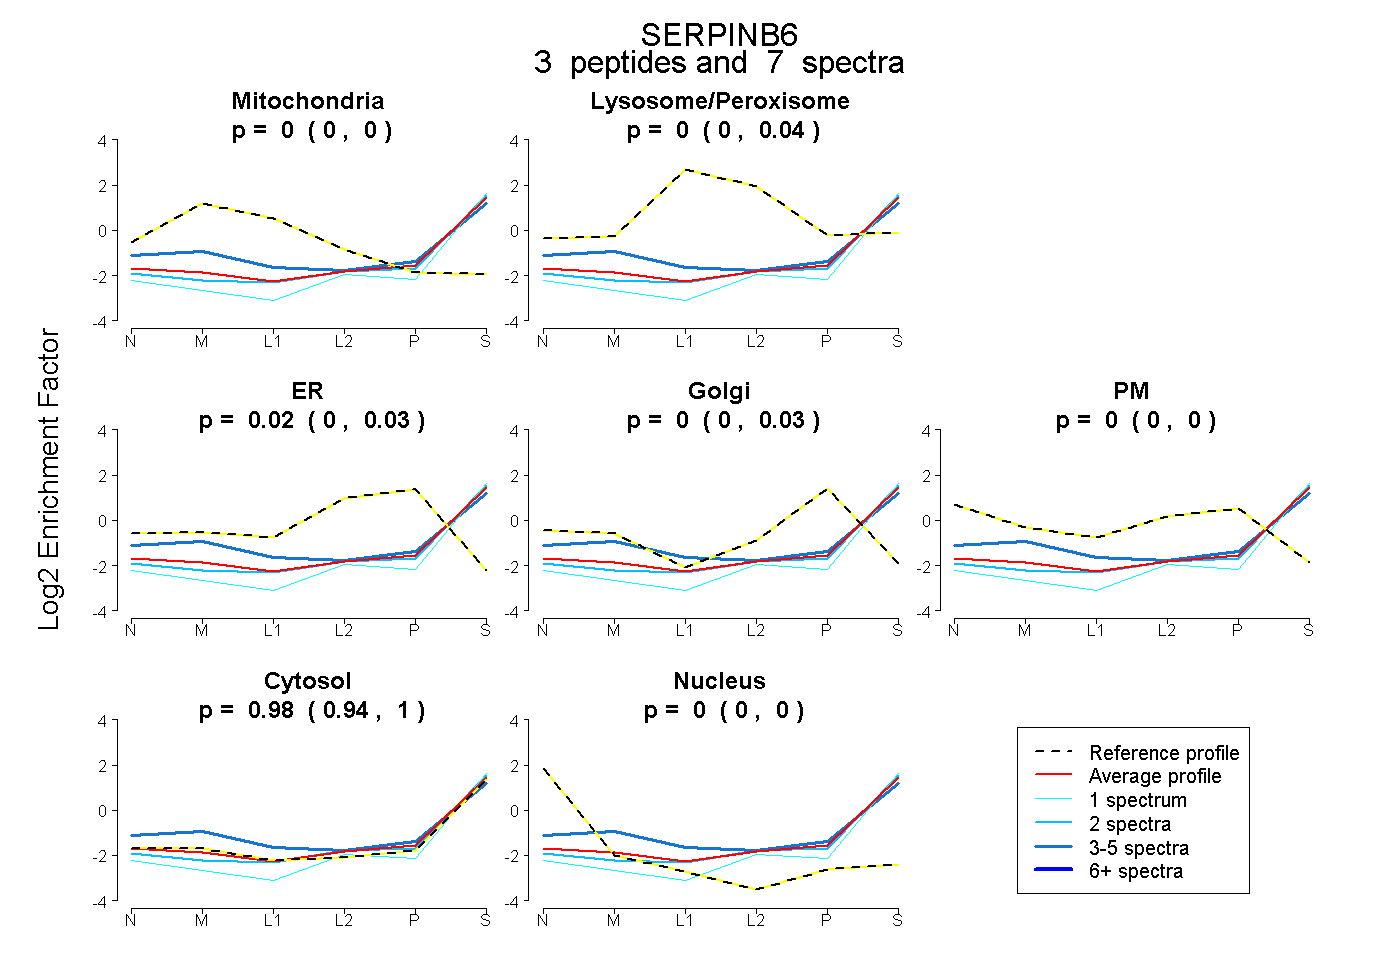
0.000 | 0.000
0.000 | 0.042
0.000 | 0.033
0.000 | 0.027
0.000 | 0.000
0.943 | 0.996
0.000 | 0.000
8peptides
spectra
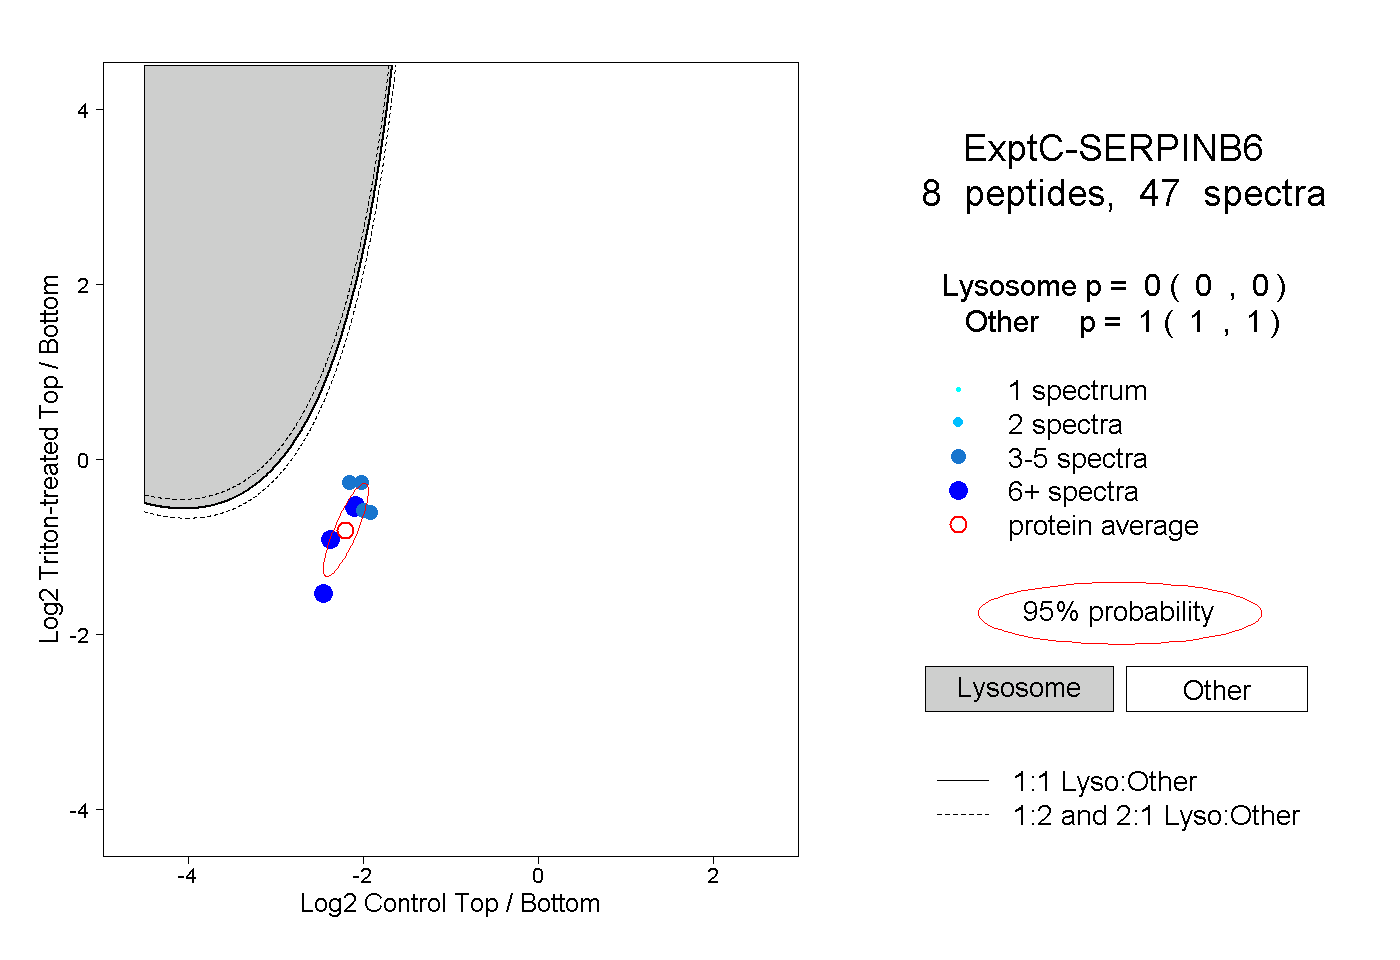
0.000 | 0.000
1.000 | 1.000
1peptide
spectra
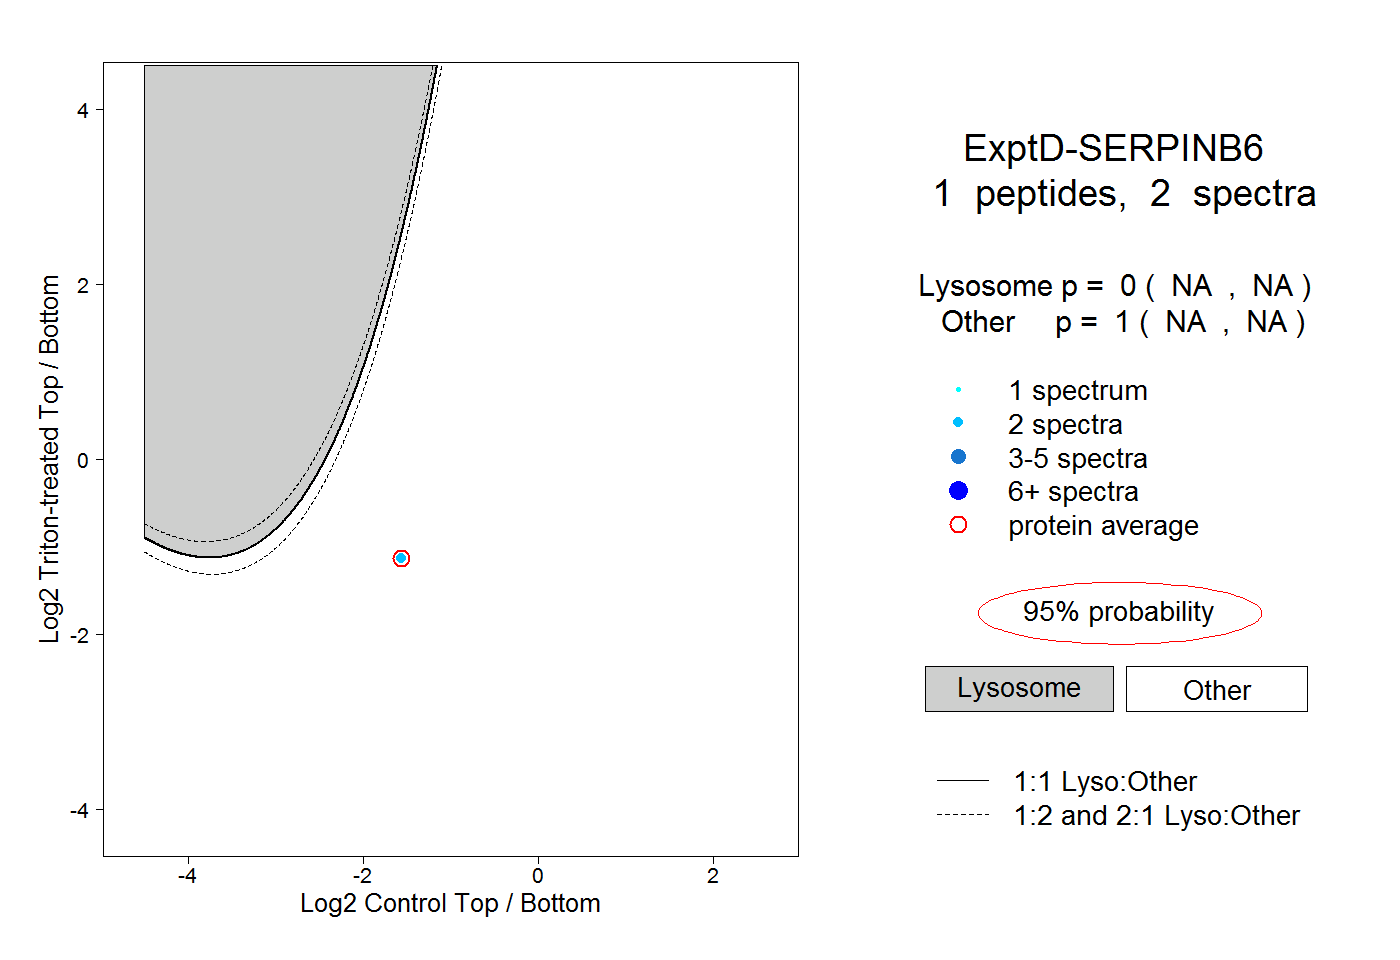
NA | NA
NA | NA