 12
12peptides
spectra
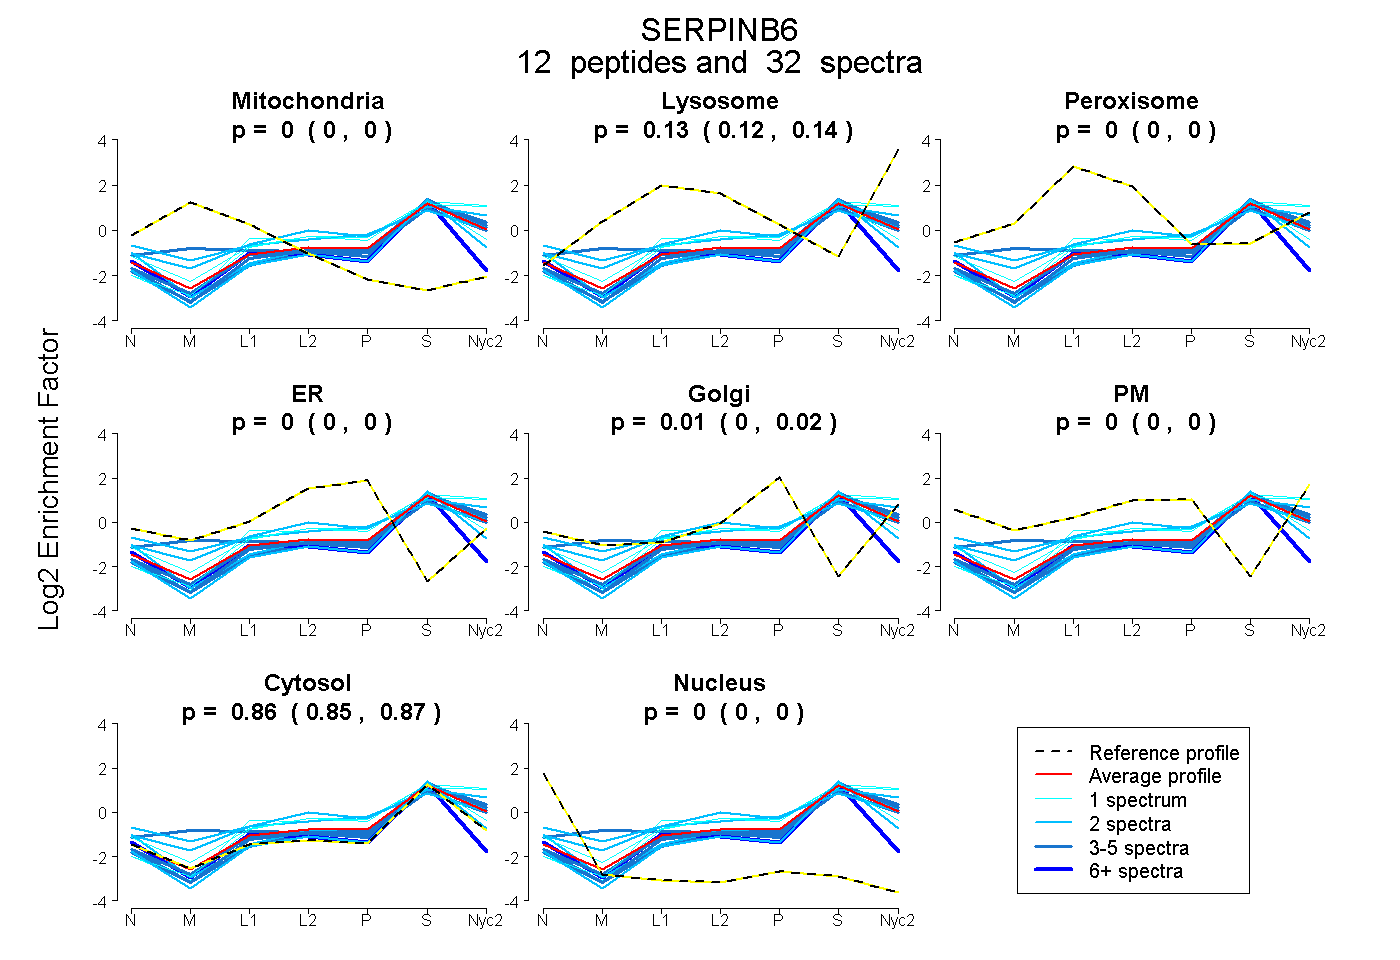
0.000 | 0.000
0.116 | 0.137
0.000 | 0.000
0.000 | 0.000
0.005 | 0.022
0.000 | 0.000
0.851 | 0.866
0.000 | 0.000
| Plot | Mito | Lyso | Perox | ER | Golgi | PM | Cytosol | Nucleus | |||||
| Expt A |
12 peptides |
32 spectra |
|
0.000 0.000 | 0.000 |
0.127 0.116 | 0.137 |
0.000 0.000 | 0.000 |
0.000 0.000 | 0.000 |
0.013 0.005 | 0.022 |
0.000 0.000 | 0.000 |
0.859 0.851 | 0.866 |
0.000 0.000 | 0.000 |
| 1 spectrum, QGLFLSK | 0.000 | 0.102 | 0.000 | 0.055 | 0.000 | 0.000 | 0.843 | 0.000 | ||
| 4 spectra, MTYIGEIFTK | 0.000 | 0.133 | 0.000 | 0.000 | 0.000 | 0.000 | 0.867 | 0.000 | ||
| 2 spectra, INTWVAK | 0.000 | 0.036 | 0.127 | 0.000 | 0.085 | 0.117 | 0.635 | 0.000 | ||
| 1 spectrum, ADFSGIASK | 0.000 | 0.265 | 0.000 | 0.000 | 0.000 | 0.000 | 0.735 | 0.000 | ||
| 4 spectra, LGMTDAFMEGR | 0.000 | 0.096 | 0.000 | 0.000 | 0.000 | 0.000 | 0.904 | 0.000 | ||
| 6 spectra, GILFCGR | 0.000 | 0.000 | 0.006 | 0.000 | 0.000 | 0.000 | 0.950 | 0.044 | ||
| 4 spectra, FIEWTR | 0.000 | 0.054 | 0.000 | 0.000 | 0.000 | 0.000 | 0.946 | 0.000 | ||
| 2 spectra, TGTQYLLK | 0.000 | 0.264 | 0.000 | 0.000 | 0.007 | 0.062 | 0.667 | 0.000 | ||
| 3 spectra, GMTASQMVQTLSLDK | 0.108 | 0.192 | 0.000 | 0.000 | 0.000 | 0.000 | 0.700 | 0.000 | ||
| 1 spectrum, TEEKPVQMMFMK | 0.000 | 0.277 | 0.000 | 0.000 | 0.024 | 0.000 | 0.699 | 0.000 | ||
| 2 spectra, TCDILASFK | 0.000 | 0.000 | 0.000 | 0.000 | 0.000 | 0.000 | 1.000 | 0.000 | ||
| 2 spectra, LEENYDMK | 0.000 | 0.034 | 0.000 | 0.000 | 0.015 | 0.073 | 0.878 | 0.000 |
| Plot | Mito | Lyso or Perox | ER | Golgi | PM | Cytosol | Nucleus | ||||||
| Expt B |
3 peptides |
7 spectra |
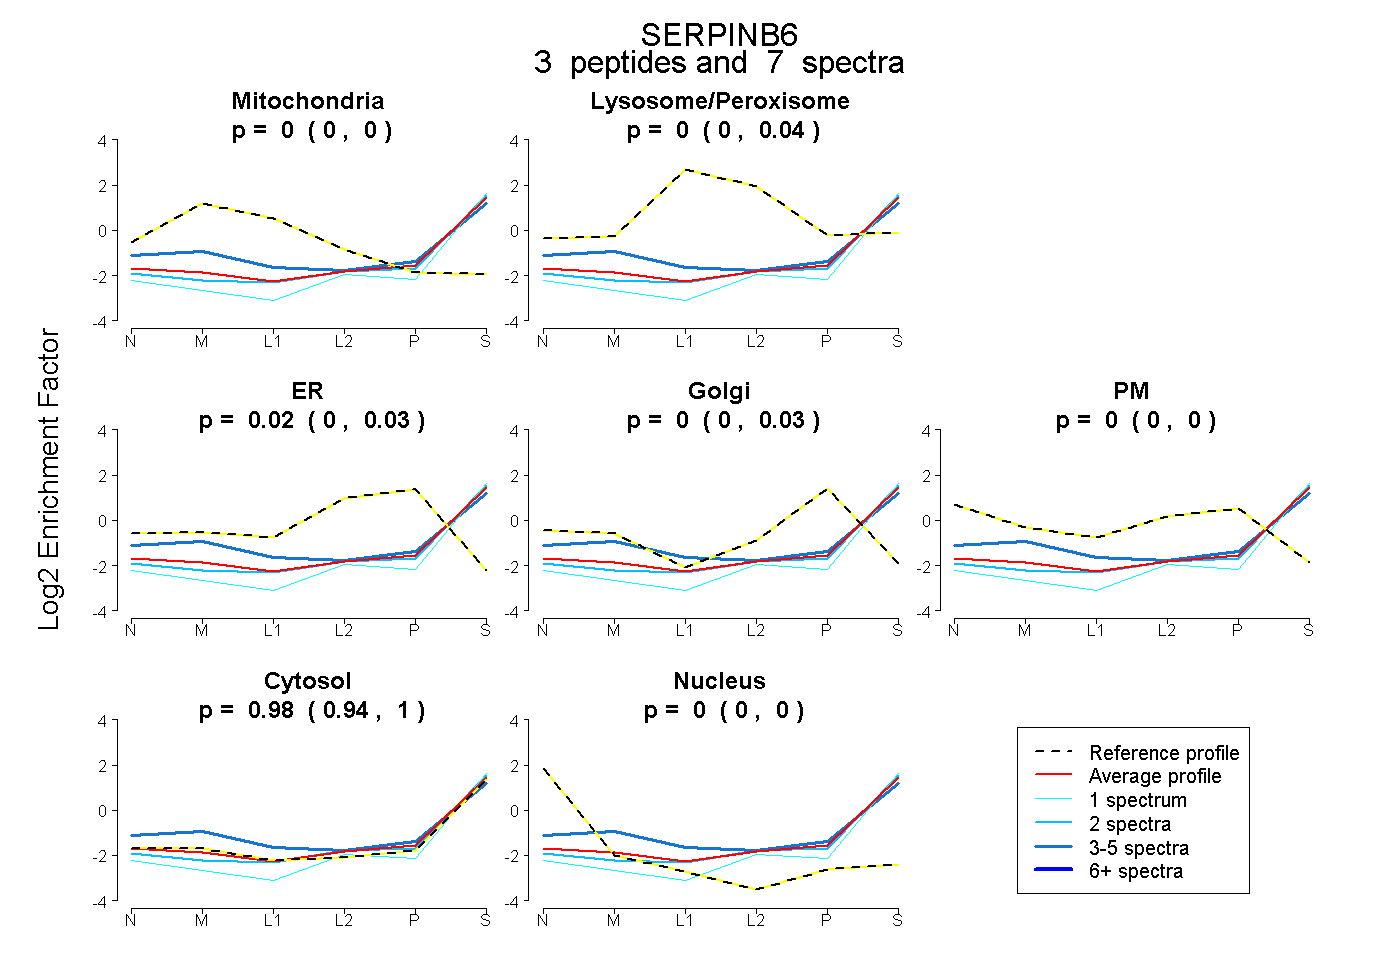 |
0.000 0.000 | 0.000 |
0.000 0.000 | 0.042 |
0.024 0.000 | 0.033 |
0.000 0.000 | 0.027 |
0.000 0.000 | 0.000 |
0.976 0.943 | 0.996 |
0.000 0.000 | 0.000 |
|||
| Plot | Lyso | Other | |||||||||||
| Expt C |
8 peptides |
47 spectra |
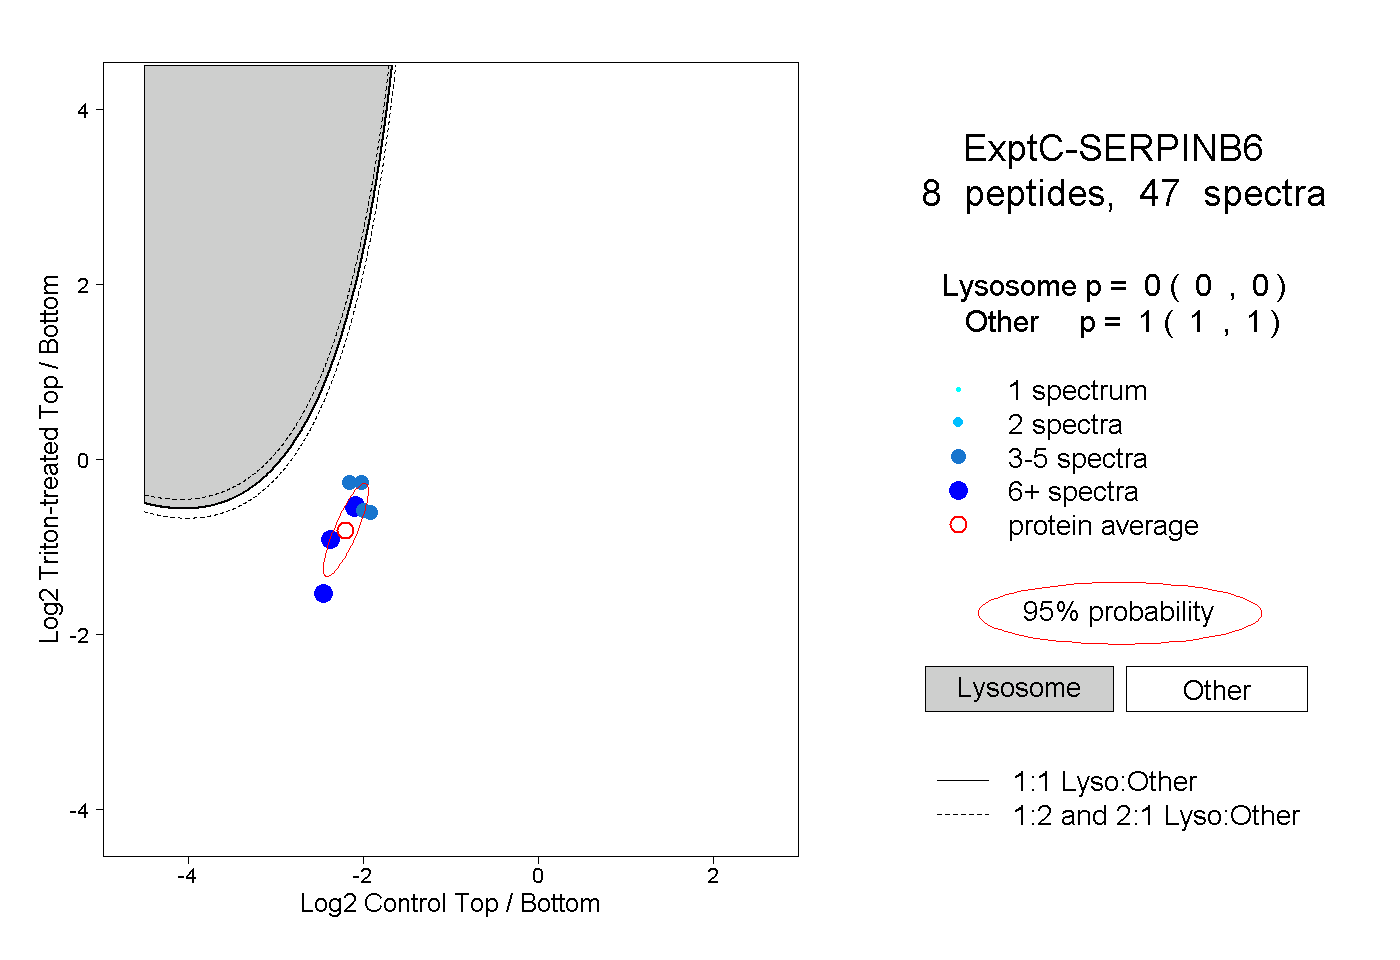 |
0.000 0.000 | 0.000 |
1.000 1.000 | 1.000 |
||||||||
| Plot | Lyso | Other | |||||||||||
| Expt D |
1 peptide |
2 spectra |
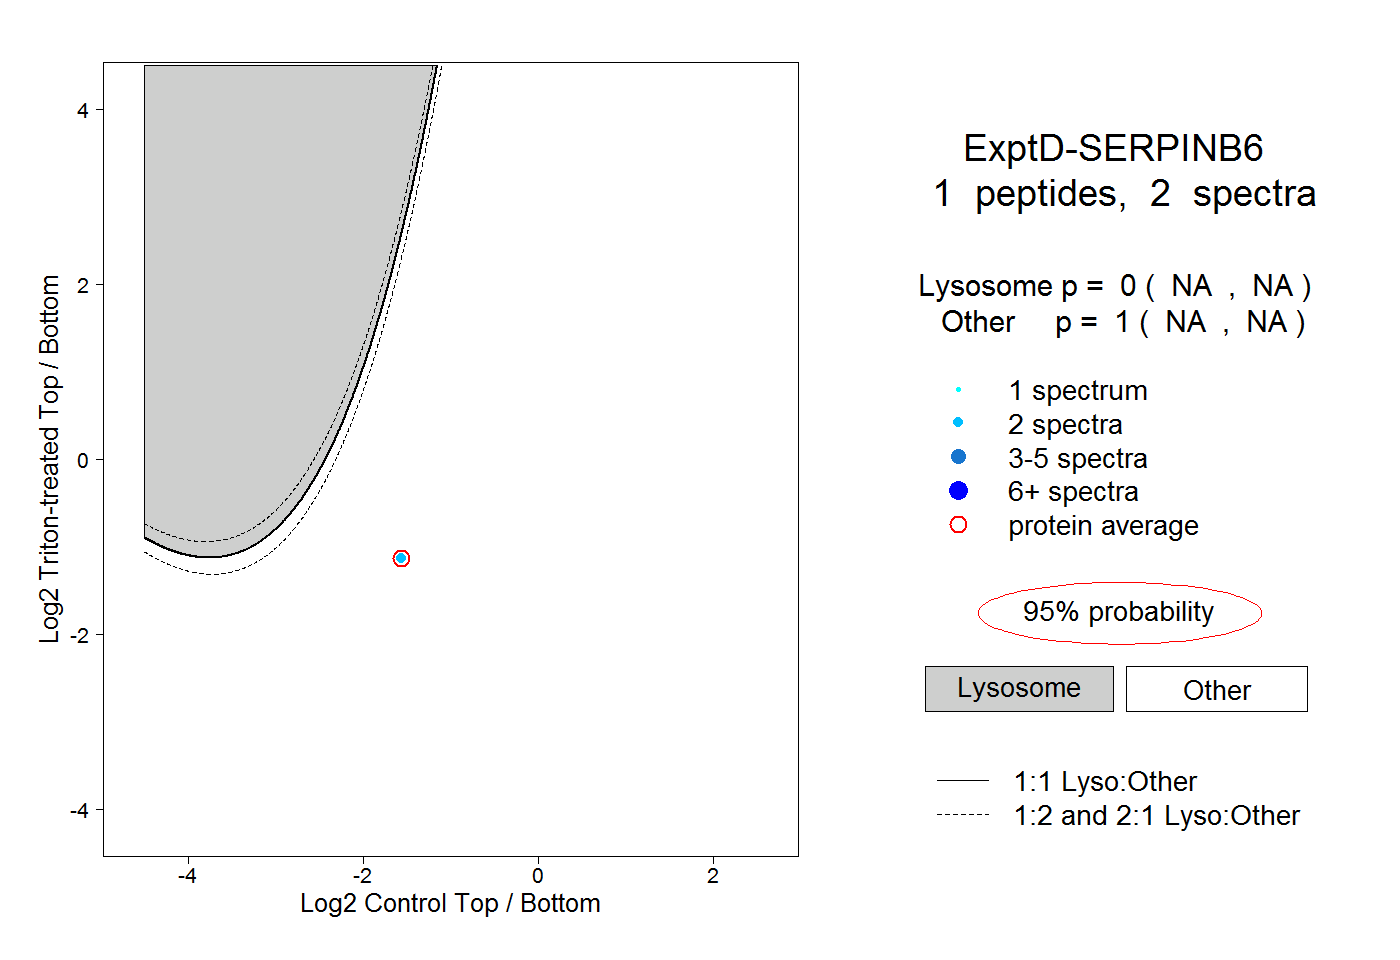 |
0.000 NA | NA |
1.000 NA | NA |