 24
24peptides
spectra
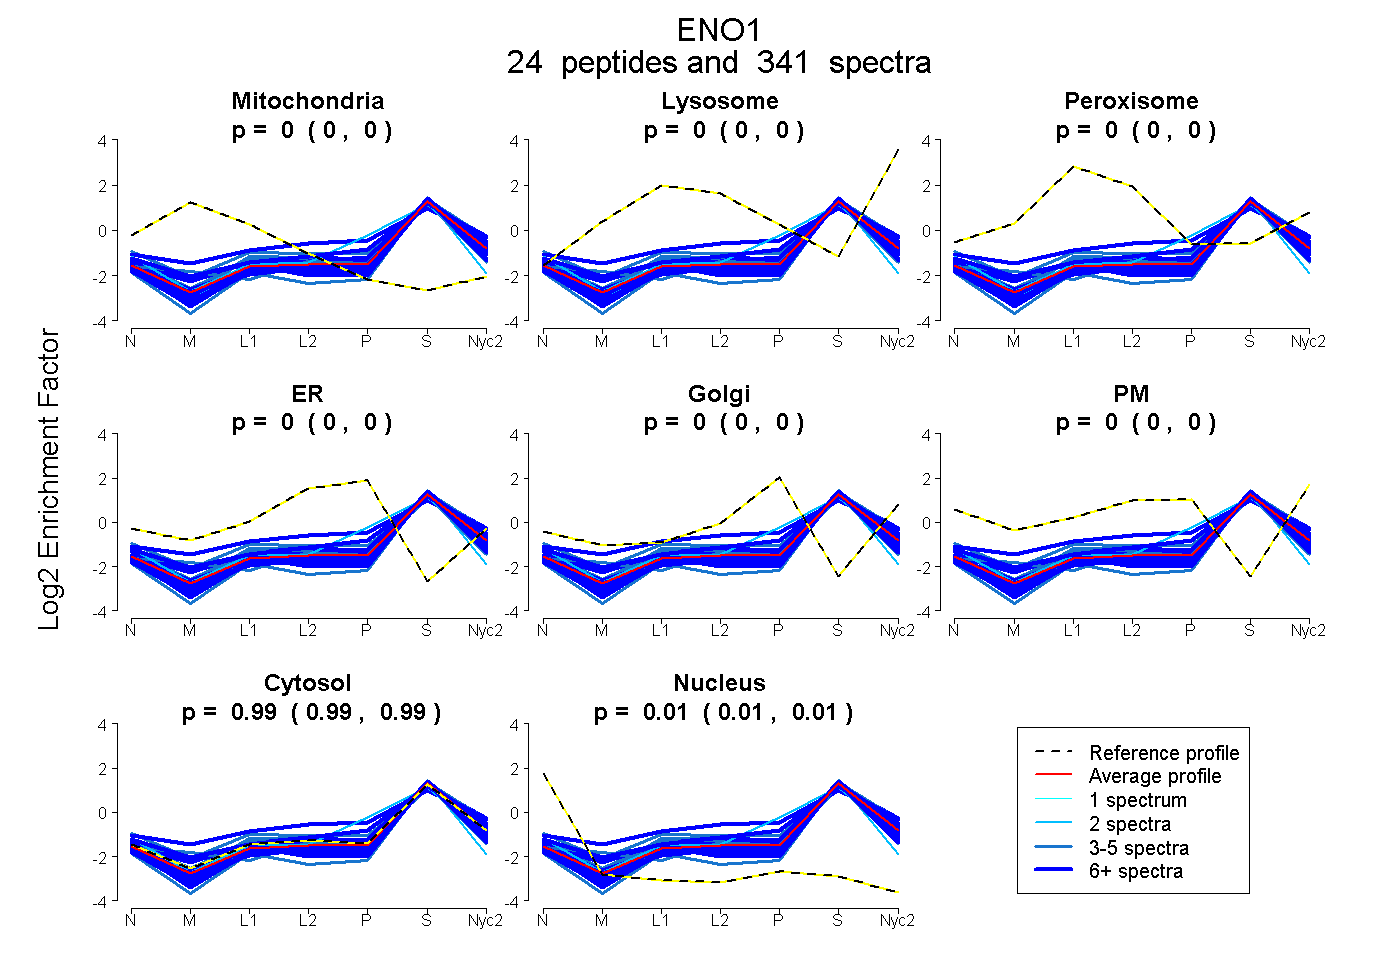
0.000 | 0.000
0.000 | 0.000
0.000 | 0.000
0.000 | 0.000
0.000 | 0.000
0.000 | 0.000
0.991 | 0.993
0.007 | 0.009
18peptides
spectra
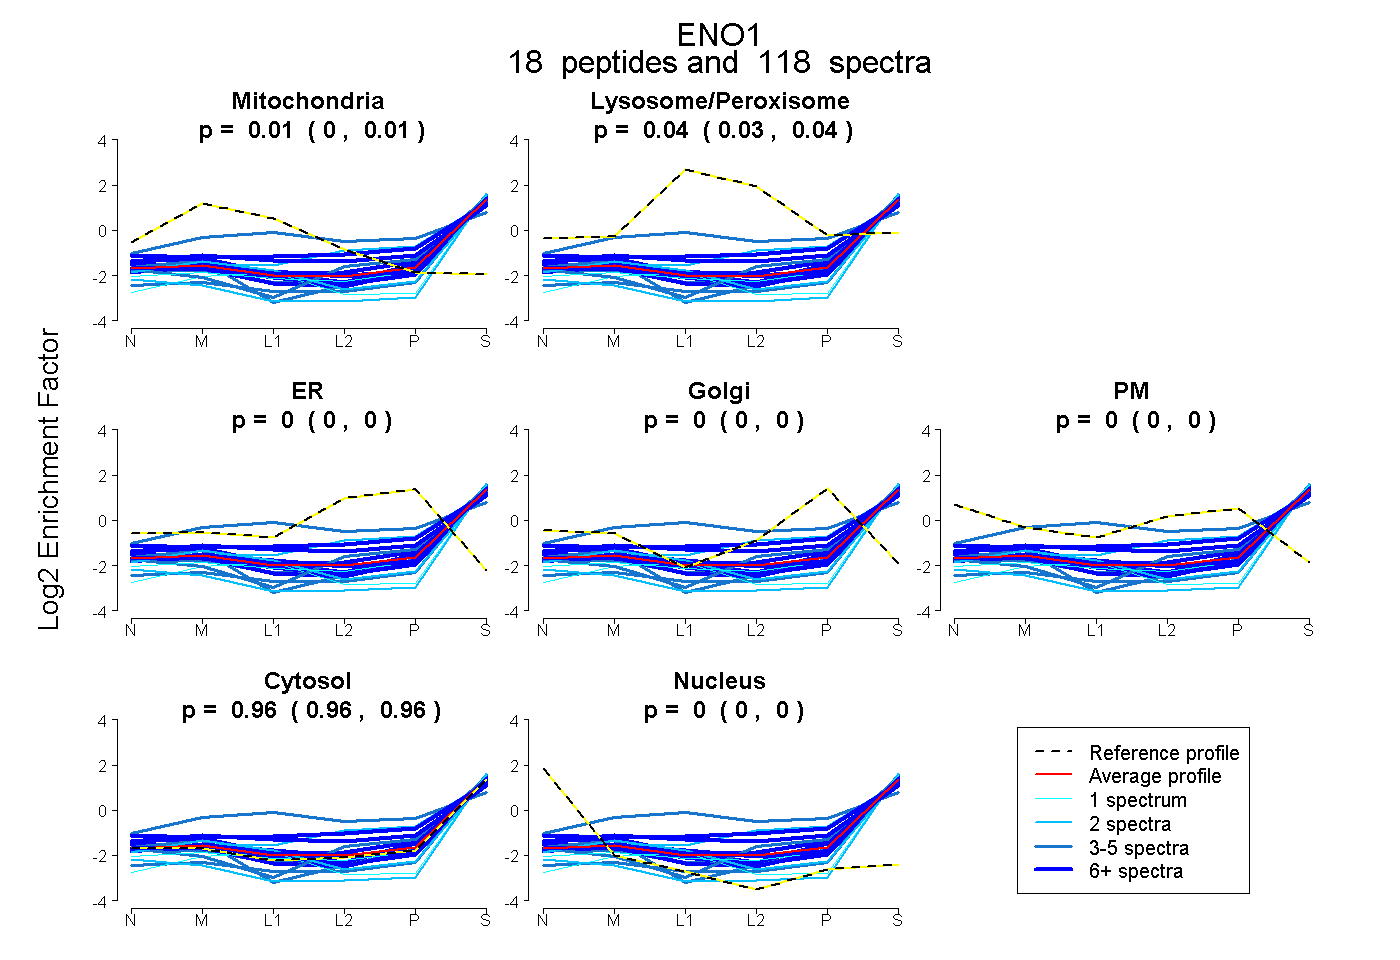
0.000 | 0.009
0.030 | 0.039
0.000 | 0.000
0.000 | 0.005
0.000 | 0.000
0.955 | 0.961
0.000 | 0.000
22peptides
spectra
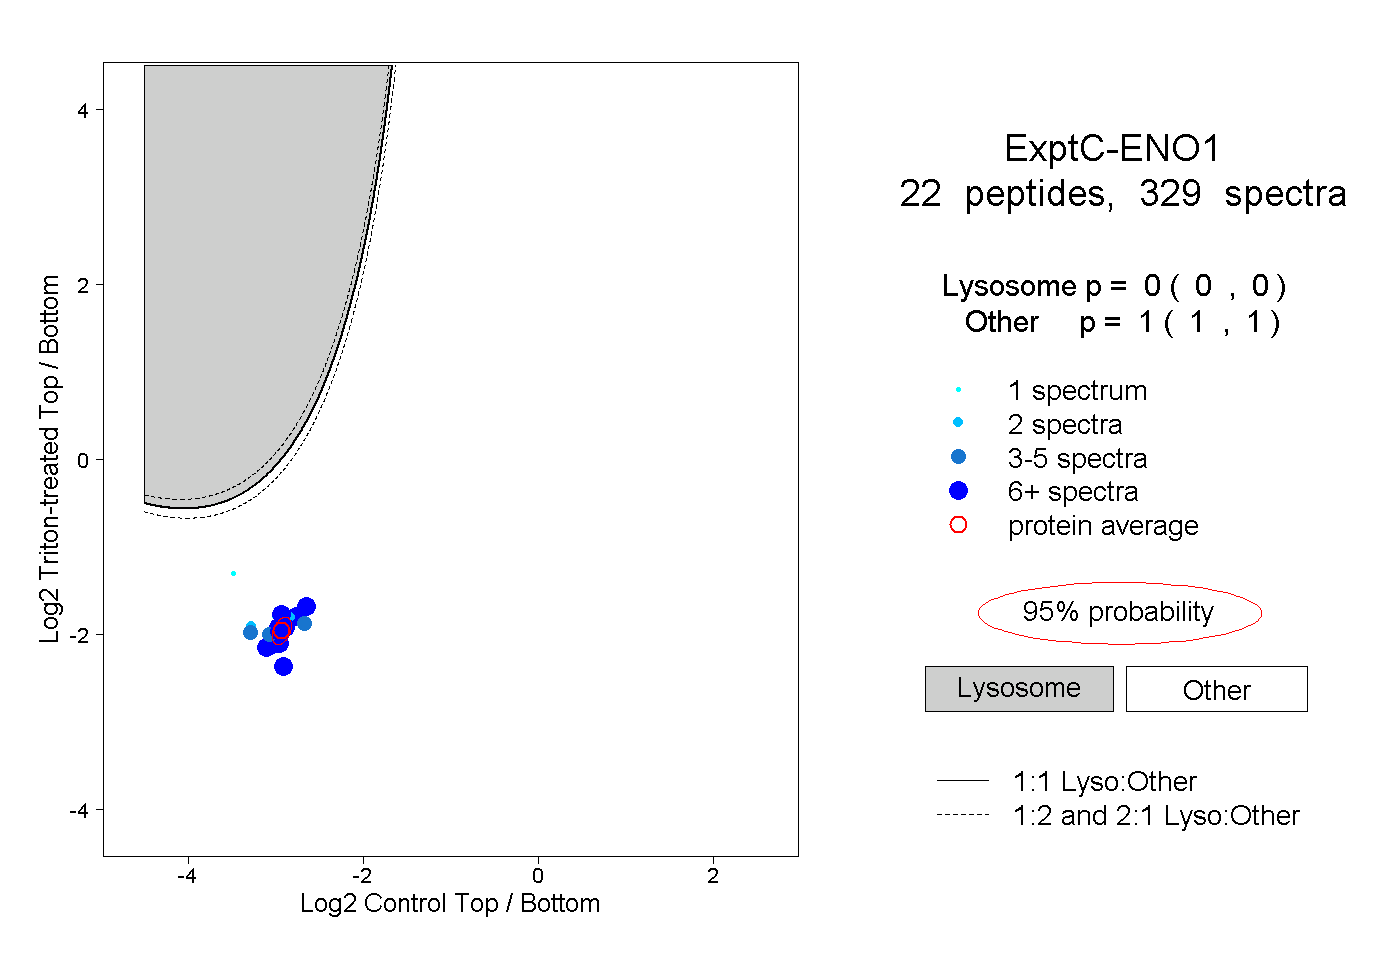
0.000 | 0.000
1.000 | 1.000
13peptides
spectra
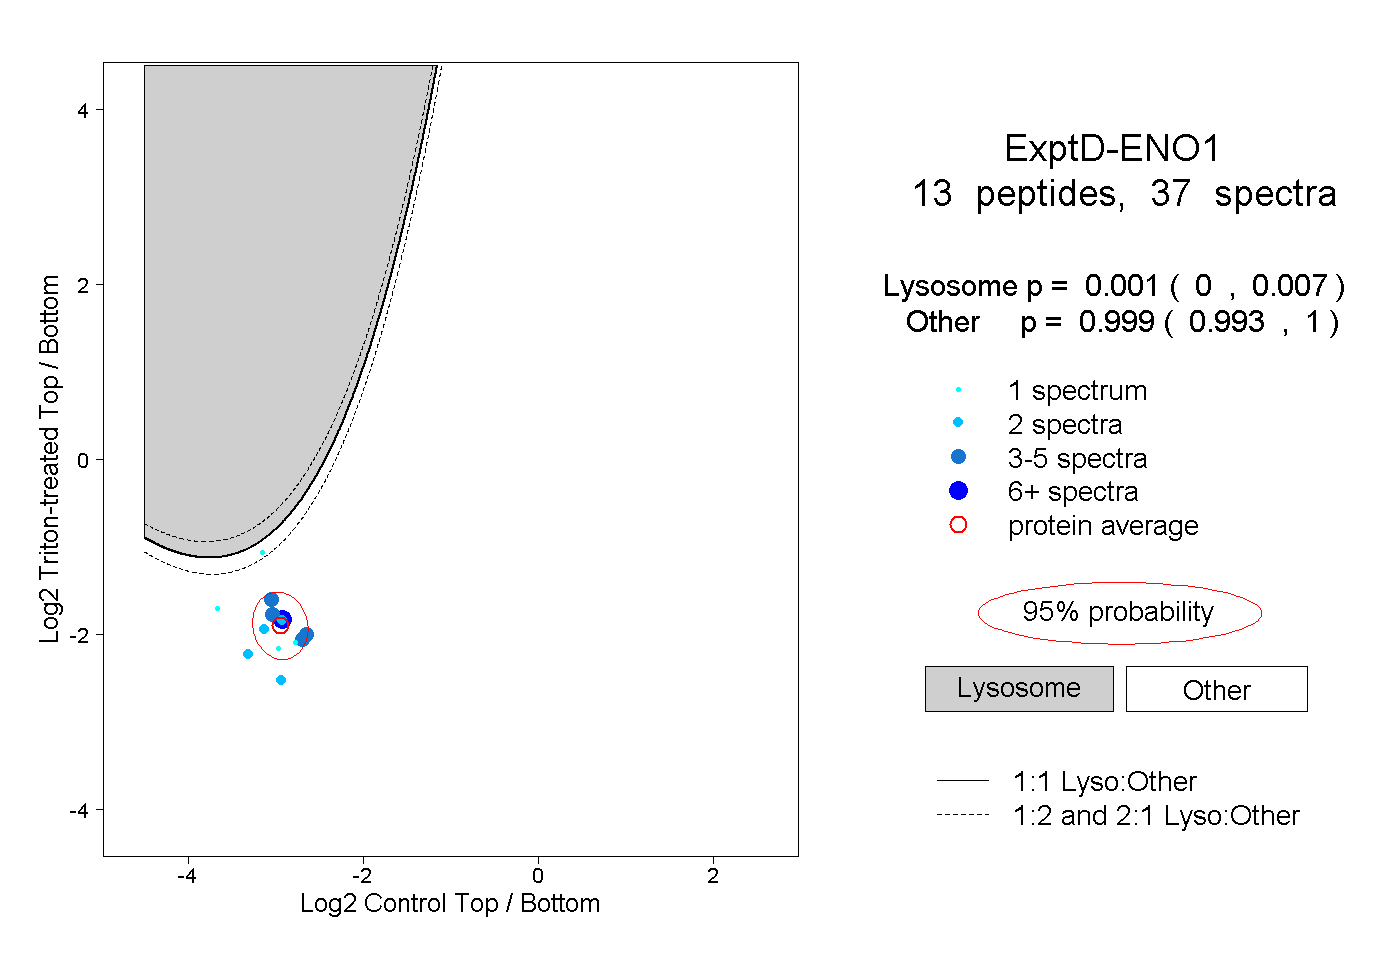
0.000 | 0.007
0.993 | 1.000