 24
24peptides
spectra
0.000 | 0.000
0.000 | 0.000
0.000 | 0.000
0.000 | 0.000
0.000 | 0.000
0.000 | 0.000
0.991 | 0.993
0.007 | 0.009
| Plot | Mito | Lyso | Perox | ER | Golgi | PM | Cytosol | Nucleus | |||||
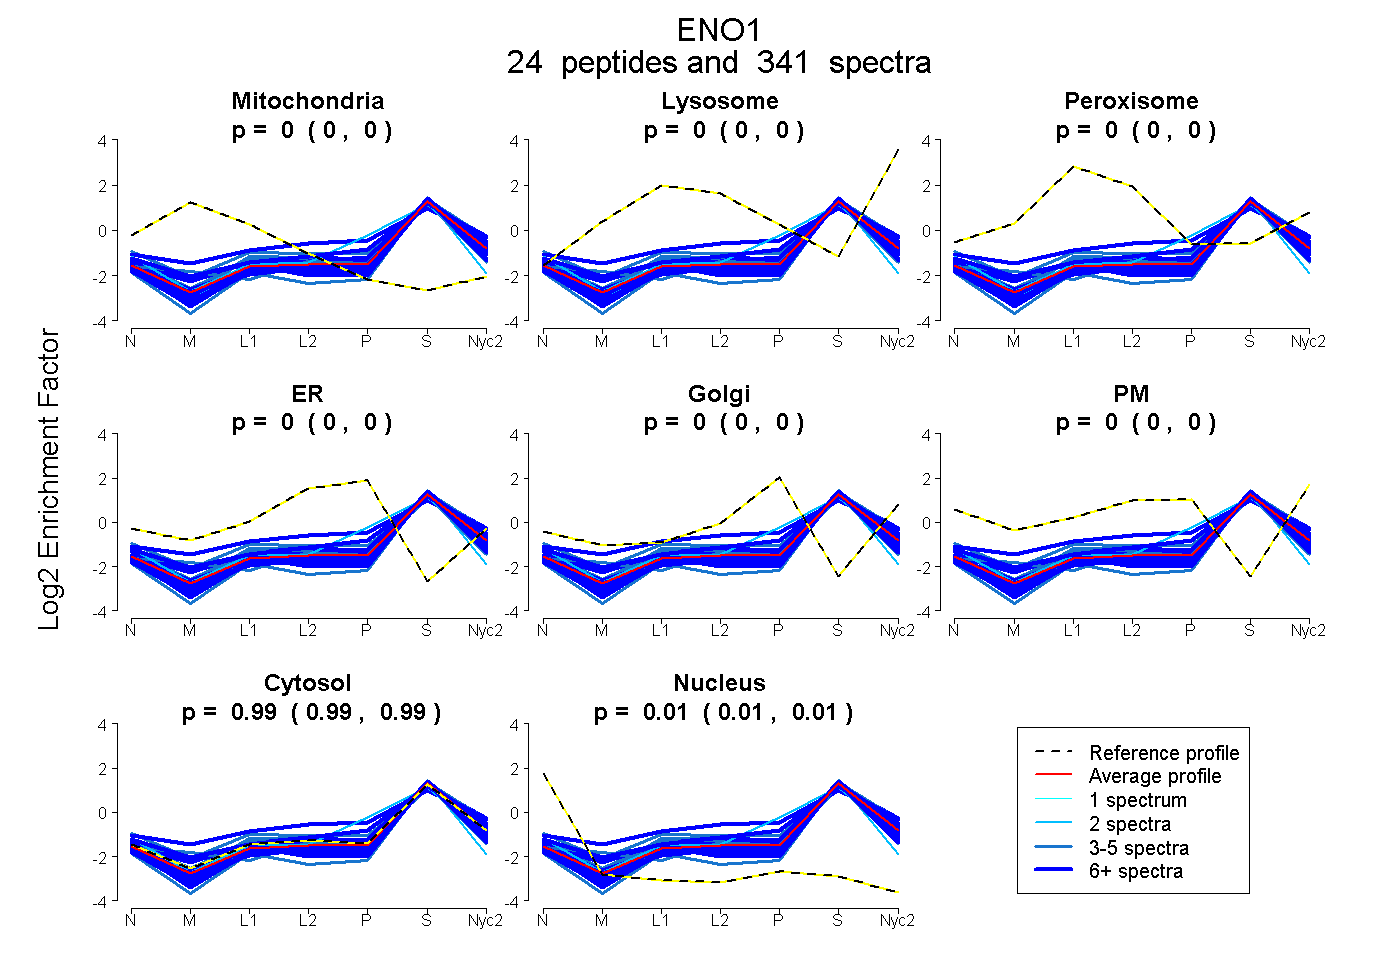
| Expt A |
24 peptides |
341 spectra |
|
0.000 0.000 | 0.000 |
0.000 0.000 | 0.000 |
0.000 0.000 | 0.000 |
0.000 0.000 | 0.000 |
0.000 0.000 | 0.000 |
0.000 0.000 | 0.000 |
0.992 0.991 | 0.993 |
0.008 0.007 | 0.009 |
| 2 spectra, VNQIGSVTESLQACK | 0.000 | 0.000 | 0.000 | 0.000 | 0.116 | 0.000 | 0.881 | 0.003 | ||
| 16 spectra, TIAPALVSK | 0.000 | 0.000 | 0.000 | 0.000 | 0.000 | 0.000 | 1.000 | 0.000 | ||
| 12 spectra, SPDDASR | 0.000 | 0.000 | 0.000 | 0.000 | 0.000 | 0.000 | 0.981 | 0.019 | ||
| 39 spectra, IEEELGSK | 0.000 | 0.000 | 0.000 | 0.000 | 0.000 | 0.000 | 0.979 | 0.021 | ||
| 6 spectra, GNPTVEVDLYTAK | 0.000 | 0.000 | 0.000 | 0.000 | 0.000 | 0.000 | 0.959 | 0.041 | ||
| 18 spectra, EIFDSR | 0.000 | 0.000 | 0.000 | 0.000 | 0.000 | 0.000 | 0.949 | 0.051 | ||
| 33 spectra, AVEHINK | 0.000 | 0.000 | 0.000 | 0.000 | 0.000 | 0.000 | 0.998 | 0.002 | ||
| 10 spectra, LNVVEQEK | 0.007 | 0.030 | 0.000 | 0.000 | 0.023 | 0.000 | 0.940 | 0.000 | ||
| 3 spectra, LAMQEFMILPVGASSFR | 0.000 | 0.027 | 0.000 | 0.000 | 0.000 | 0.000 | 0.973 | 0.000 | ||
| 21 spectra, LAQSNGWGVMVSHR | 0.000 | 0.043 | 0.121 | 0.000 | 0.127 | 0.000 | 0.709 | 0.000 | ||
| 41 spectra, GVPLYR | 0.000 | 0.000 | 0.000 | 0.000 | 0.000 | 0.000 | 0.991 | 0.009 | ||
| 10 spectra, TGAPCR | 0.000 | 0.000 | 0.000 | 0.000 | 0.000 | 0.000 | 0.991 | 0.009 | ||
| 36 spectra, YNQILR | 0.000 | 0.048 | 0.000 | 0.000 | 0.079 | 0.000 | 0.872 | 0.000 | ||
| 5 spectra, SCNCLLLK | 0.038 | 0.000 | 0.000 | 0.000 | 0.000 | 0.000 | 0.919 | 0.043 | ||
| 4 spectra, DATNVGDEGGFAPNILENK | 0.000 | 0.000 | 0.066 | 0.000 | 0.000 | 0.072 | 0.861 | 0.000 | ||
| 2 spectra, FGANAILGVSLAVCK | 0.000 | 0.000 | 0.000 | 0.000 | 0.000 | 0.000 | 0.936 | 0.064 | ||
| 3 spectra, AAVPSGASTGIYEALELR | 0.000 | 0.000 | 0.029 | 0.000 | 0.000 | 0.000 | 0.969 | 0.002 | ||
| 19 spectra, IGAEVYHNLK | 0.000 | 0.000 | 0.000 | 0.000 | 0.000 | 0.000 | 1.000 | 0.000 | ||
| 7 spectra, YITPDQLADLYK | 0.000 | 0.000 | 0.000 | 0.000 | 0.000 | 0.000 | 0.955 | 0.045 | ||
| 7 spectra, IDQLMIEMDGTENK | 0.000 | 0.071 | 0.000 | 0.000 | 0.000 | 0.000 | 0.929 | 0.000 | ||
| 26 spectra, YDLDFK | 0.000 | 0.000 | 0.000 | 0.000 | 0.000 | 0.000 | 0.963 | 0.037 | ||
| 14 spectra, EALELLK | 0.000 | 0.000 | 0.000 | 0.000 | 0.000 | 0.000 | 0.969 | 0.031 | ||
| 3 spectra, AGYTDQVVIGMDVAASEFYR | 0.000 | 0.000 | 0.000 | 0.000 | 0.000 | 0.000 | 0.932 | 0.068 | ||
| 4 spectra, AGAVEK | 0.000 | 0.000 | 0.000 | 0.000 | 0.000 | 0.000 | 0.972 | 0.028 |
| Plot | Mito | Lyso or Perox | ER | Golgi | PM | Cytosol | Nucleus | ||||||
| Expt B |
18 peptides |
118 spectra |
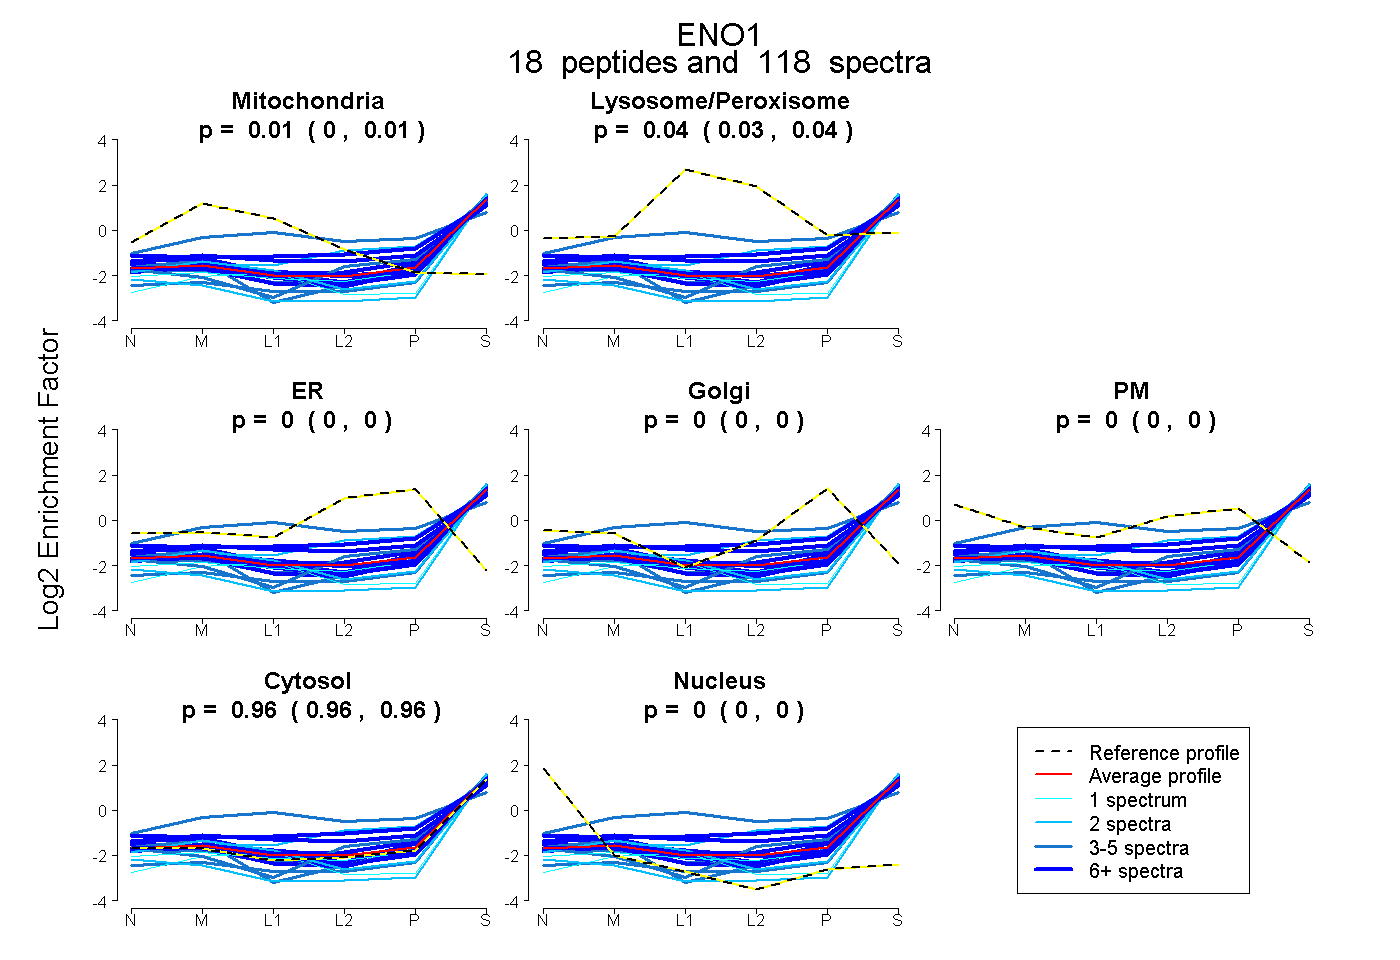 |
0.006 0.000 | 0.009 |
0.035 0.030 | 0.039 |
0.000 0.000 | 0.000 |
0.000 0.000 | 0.005 |
0.000 0.000 | 0.000 |
0.959 0.955 | 0.961 |
0.000 0.000 | 0.000 |
|||
| Plot | Lyso | Other | |||||||||||
| Expt C |
22 peptides |
329 spectra |
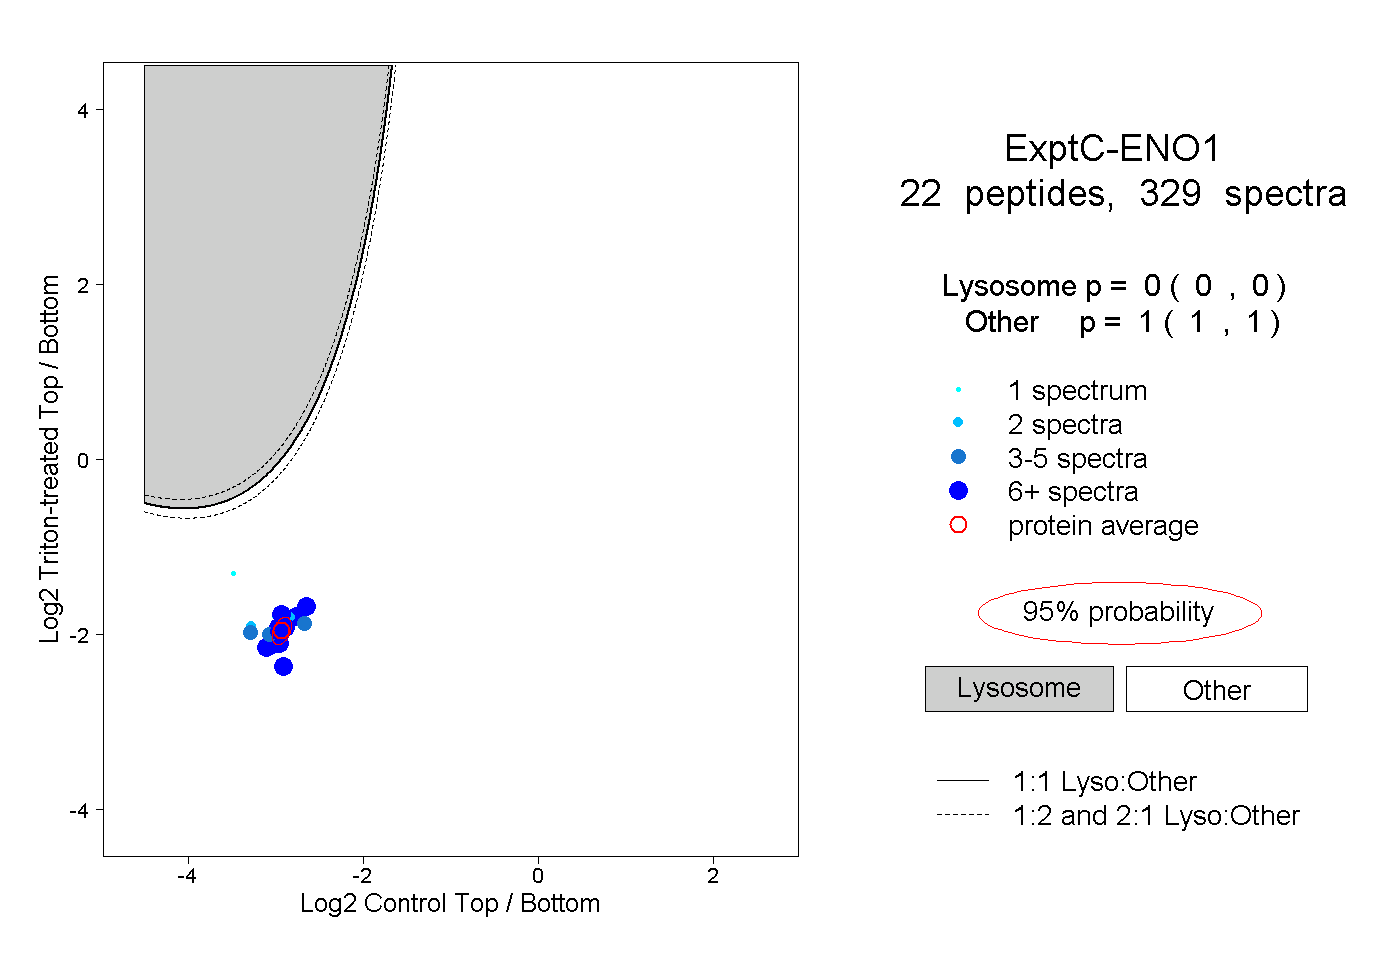 |
0.000 0.000 | 0.000 |
1.000 1.000 | 1.000 |
||||||||
| Plot | Lyso | Other | |||||||||||
| Expt D |
13 peptides |
37 spectra |
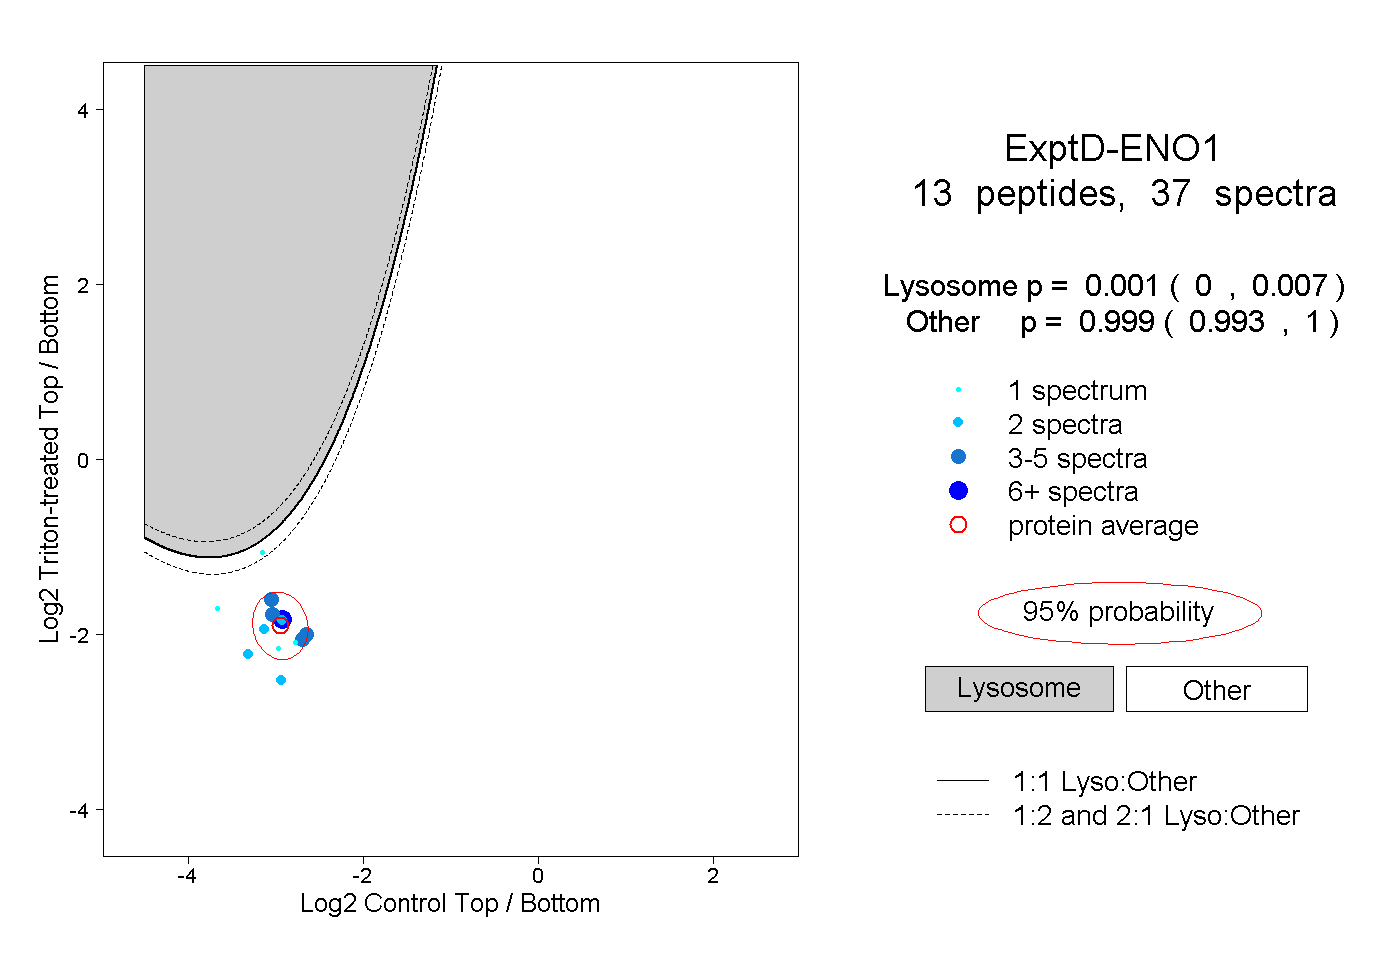 |
0.001 0.000 | 0.007 |
0.999 0.993 | 1.000 |