 2
2peptides
spectra
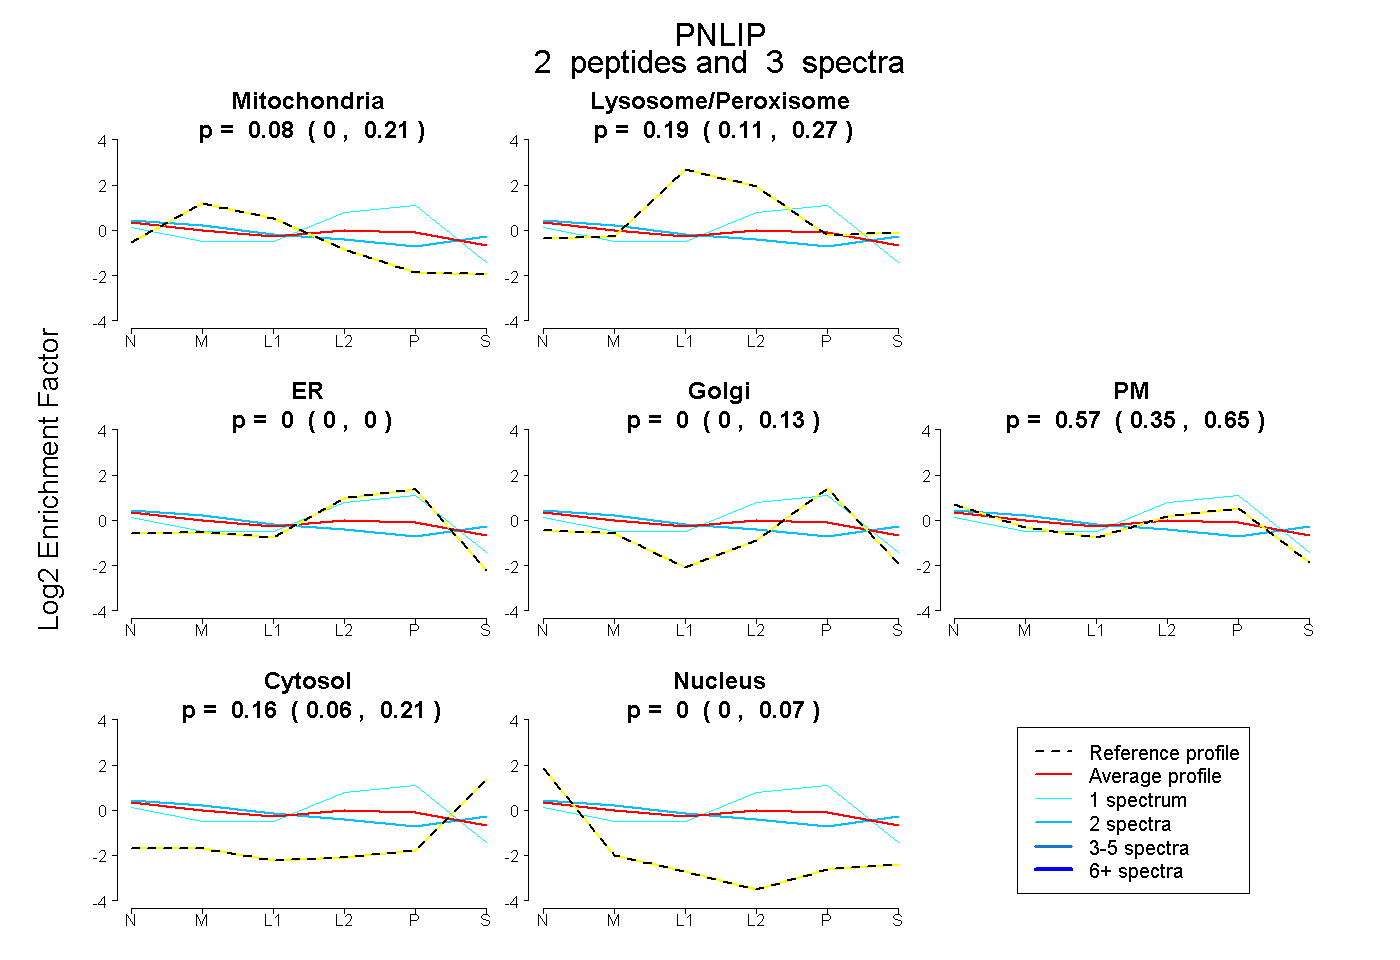
0.000 | 0.211
0.112 | 0.270
0.000 | 0.000
0.000 | 0.125
0.348 | 0.648
0.059 | 0.213
0.000 | 0.072
8peptides
spectra
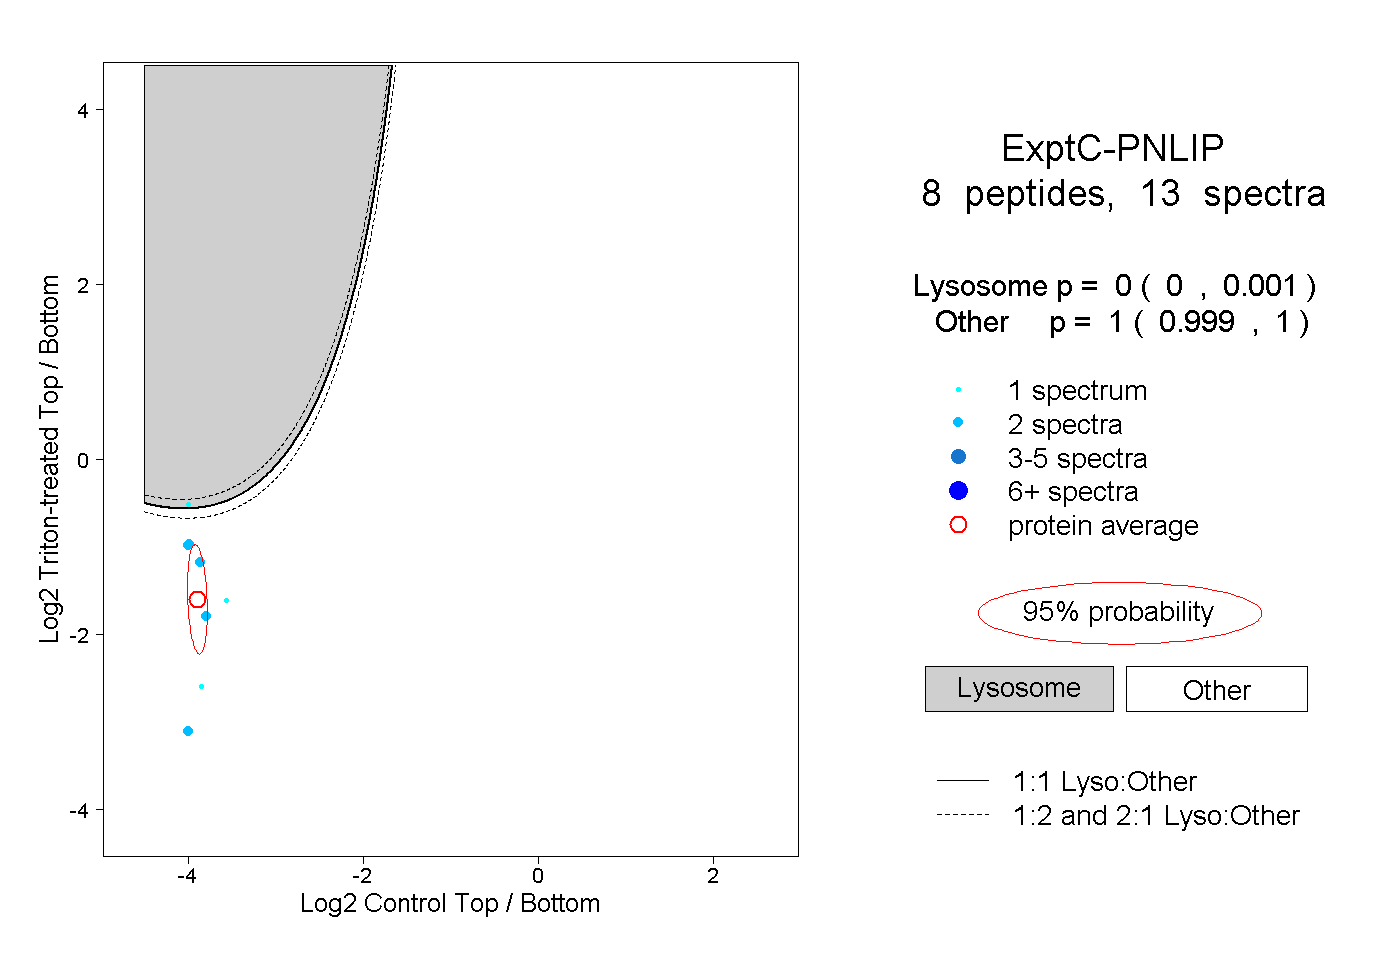
0.000 | 0.001
0.999 | 1.000
1peptide
spectrum
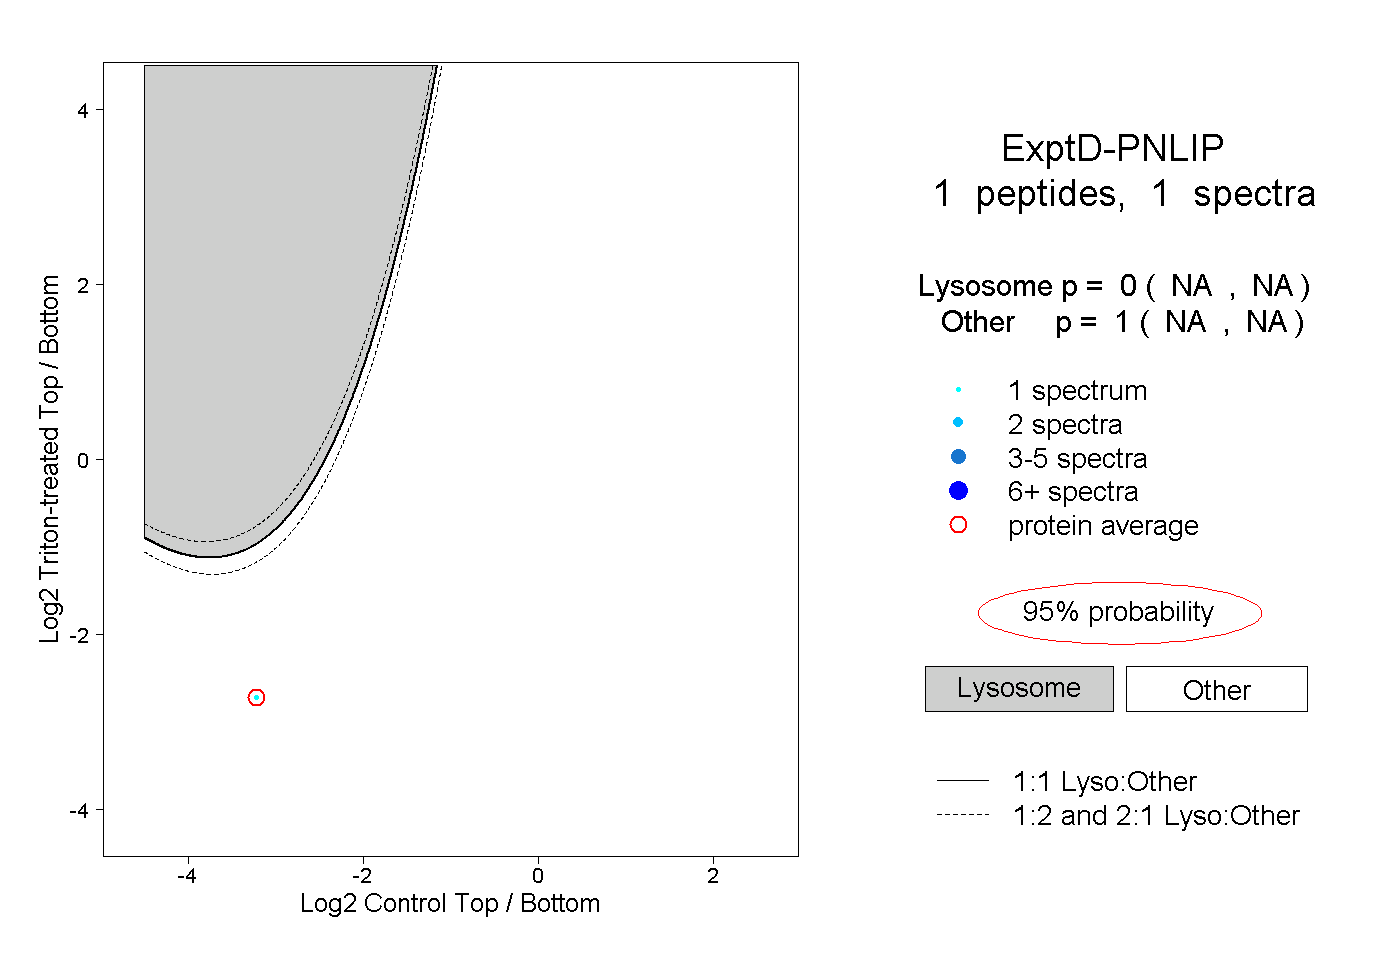
NA | NA
NA | NA