 2
2peptides
spectra
0.000 | 0.211
0.112 | 0.270
0.000 | 0.000
0.000 | 0.125
0.348 | 0.648
0.059 | 0.213
0.000 | 0.072
8peptides
spectra
0.000 | 0.001
0.999 | 1.000
| Plot | Mito | Lyso or Perox | ER | Golgi | PM | Cytosol | Nucleus | ||||||
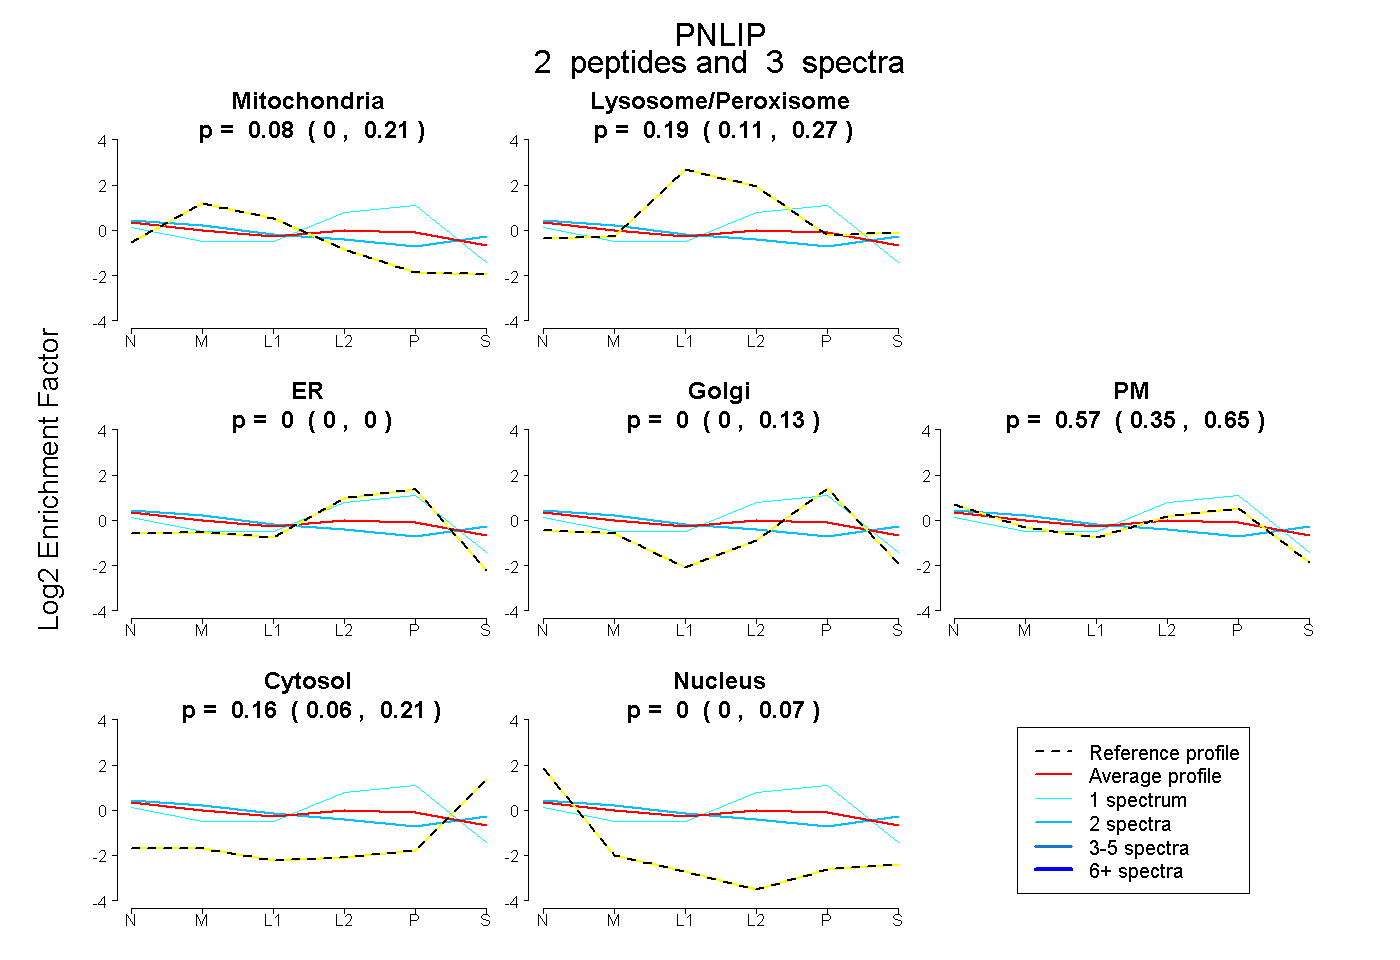
| Expt B |
2 peptides |
3 spectra |
|
0.084 0.000 | 0.211 |
0.190 0.112 | 0.270 |
0.000 0.000 | 0.000 |
0.000 0.000 | 0.125 |
0.570 0.348 | 0.648 |
0.156 0.059 | 0.213 |
0.000 0.000 | 0.072 |
|||
| Plot | Lyso | Other | |||||||||||
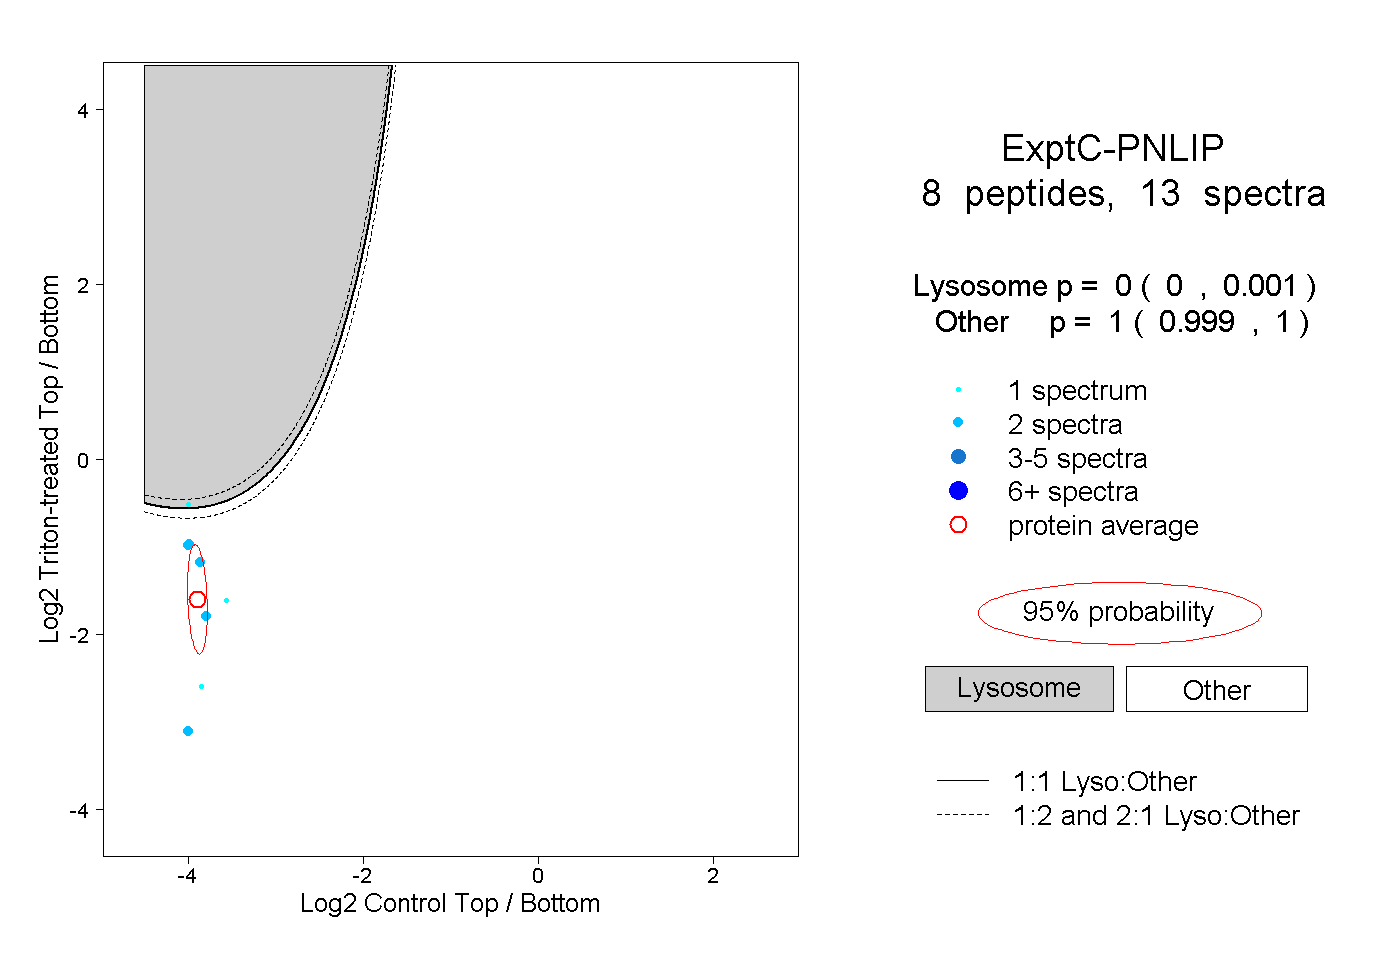
| Expt C |
8 peptides |
13 spectra |
|
0.000 0.000 | 0.001 |
1.000 0.999 | 1.000 |
| 2 spectra, FYLNTGDK | 0.000 | 1.000 | ||||||||
| 2 spectra, ITSDASSIR | 0.006 | 0.994 | ||||||||
| 2 spectra, ATYTQATQNVR | 0.000 | 1.000 | ||||||||
| 1 spectrum, YQVTVTLSGQK | 0.000 | 1.000 | ||||||||
| 2 spectra, TFGAIGR | 0.000 | 1.000 | ||||||||
| 1 spectrum, VFNFCSQDTVR | 0.000 | 1.000 | ||||||||
| 2 spectra, ALPWSPAQINTR | 0.004 | 0.996 | ||||||||
| 1 spectrum, QYEVFK | 0.637 | 0.363 |
| Plot | Lyso | Other | |||||||||||
| Expt D |
1 peptide |
1 spectrum |
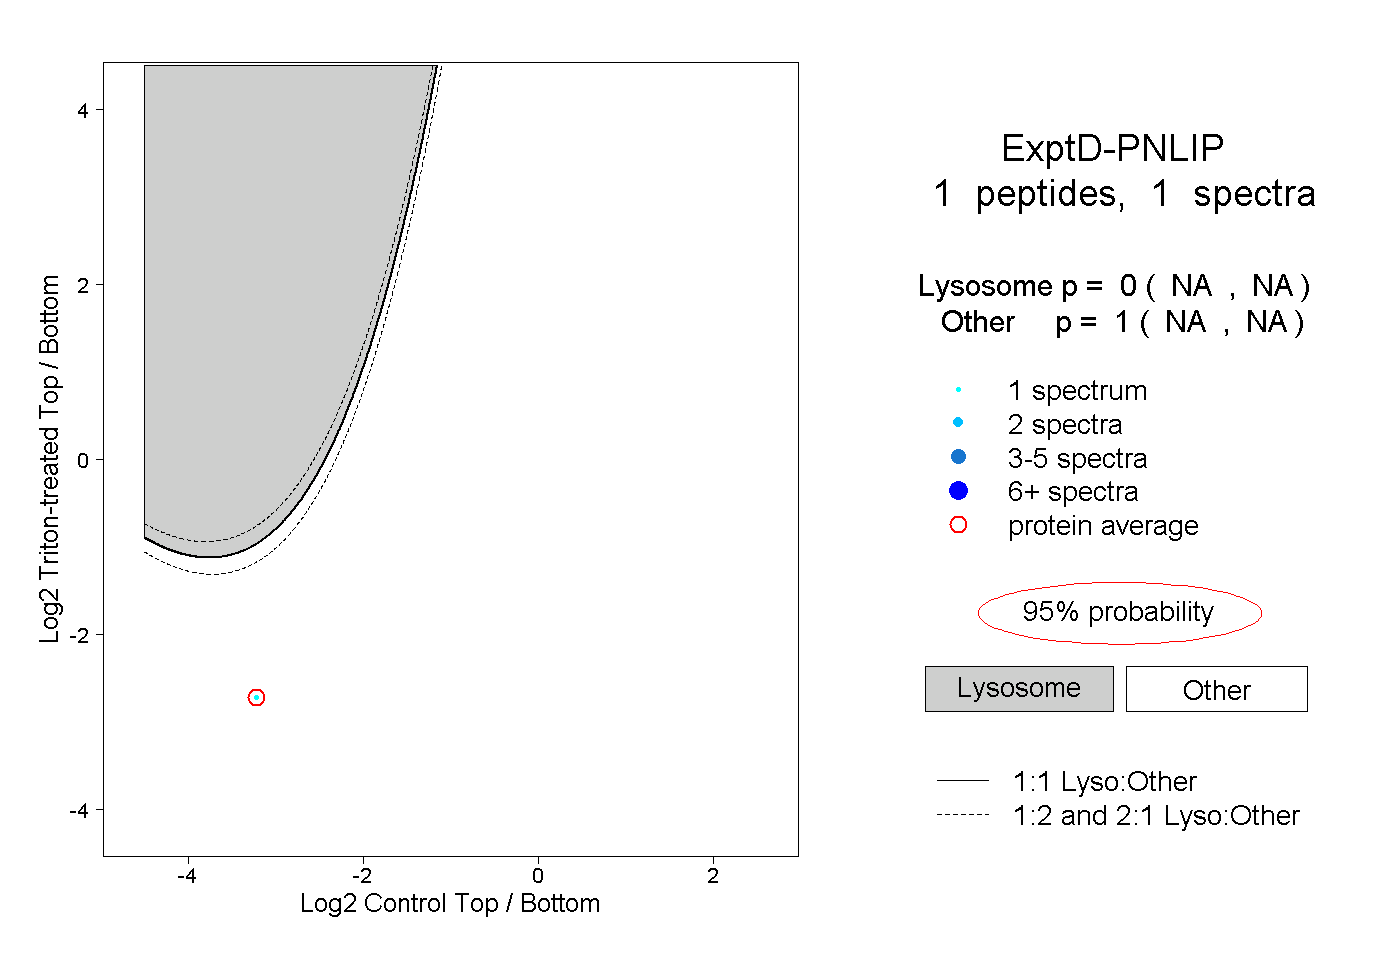 |
0.000 NA | NA |
1.000 NA | NA |