 20
20peptides
spectra
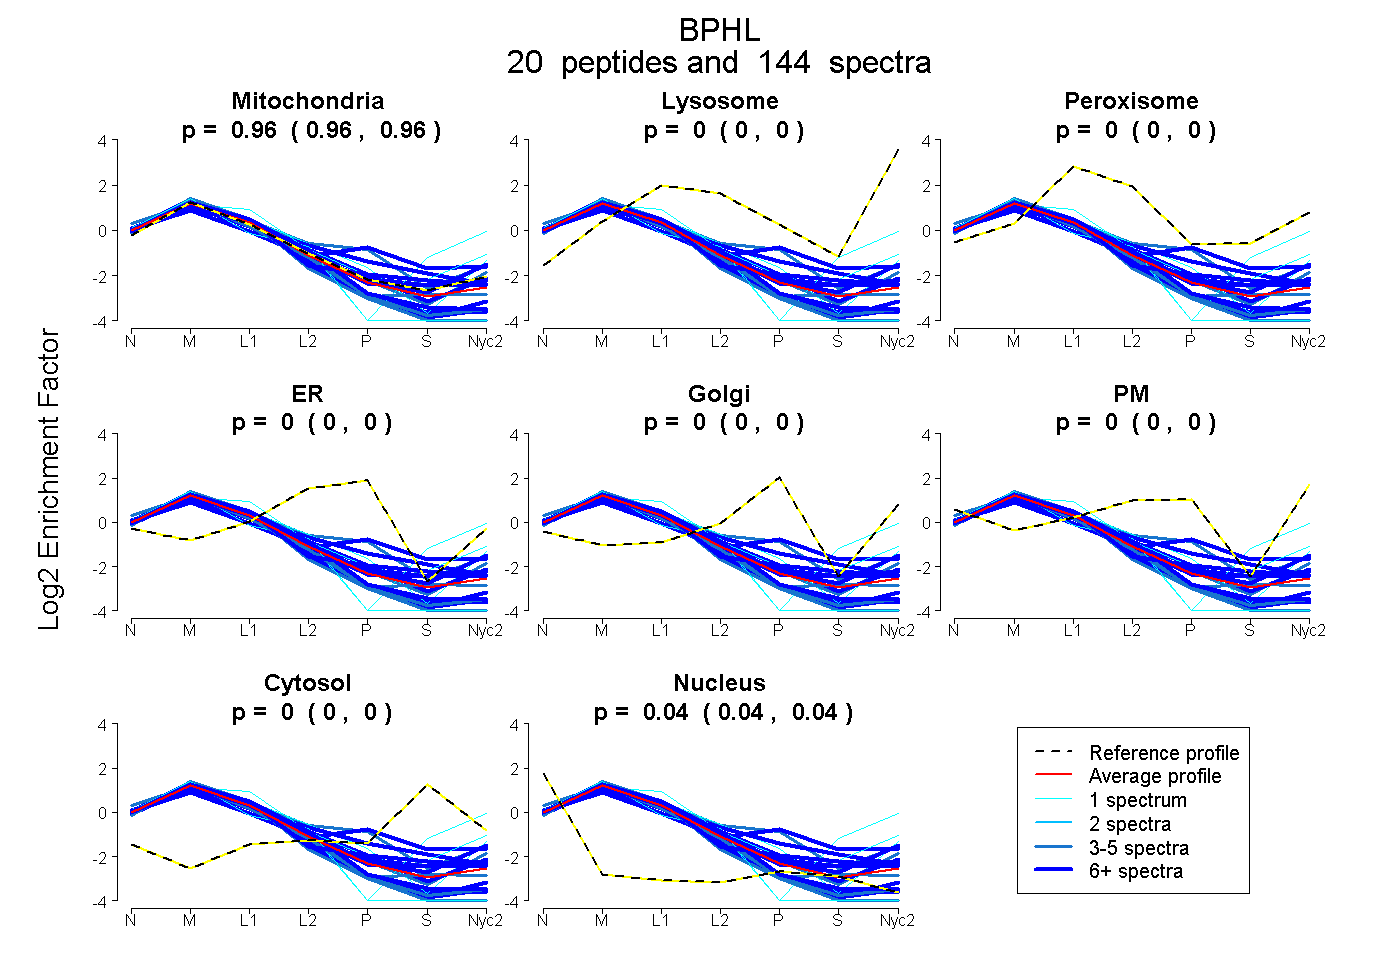
0.958 | 0.961
0.000 | 0.000
0.000 | 0.000
0.000 | 0.000
0.000 | 0.000
0.000 | 0.000
0.000 | 0.000
0.039 | 0.042
16peptides
spectra
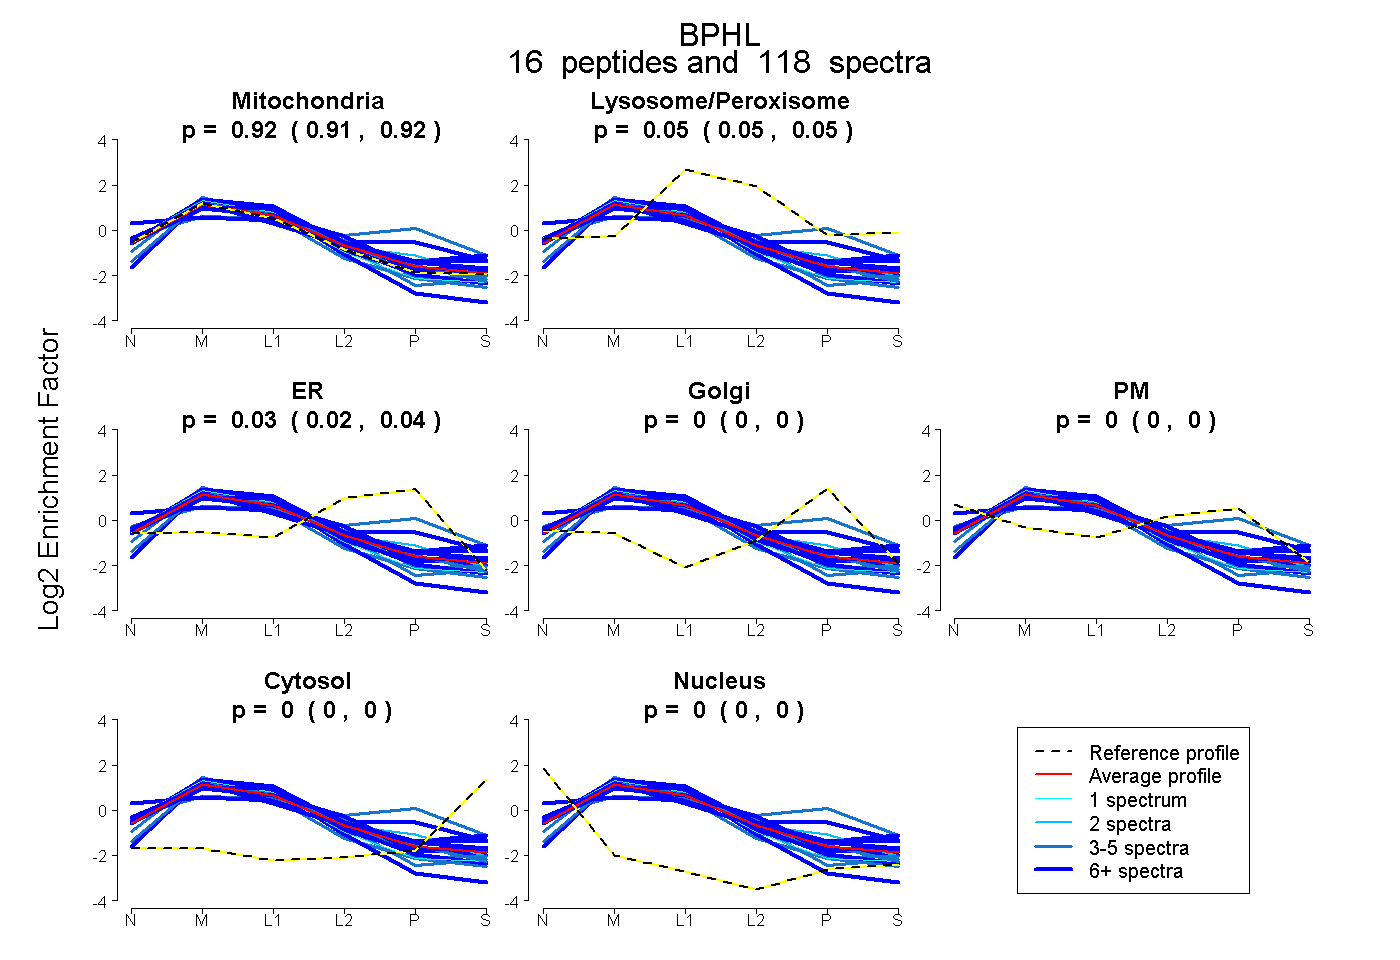
0.911 | 0.923
0.047 | 0.055
0.025 | 0.036
0.000 | 0.000
0.000 | 0.000
0.000 | 0.000
0.000 | 0.000
19peptides
spectra
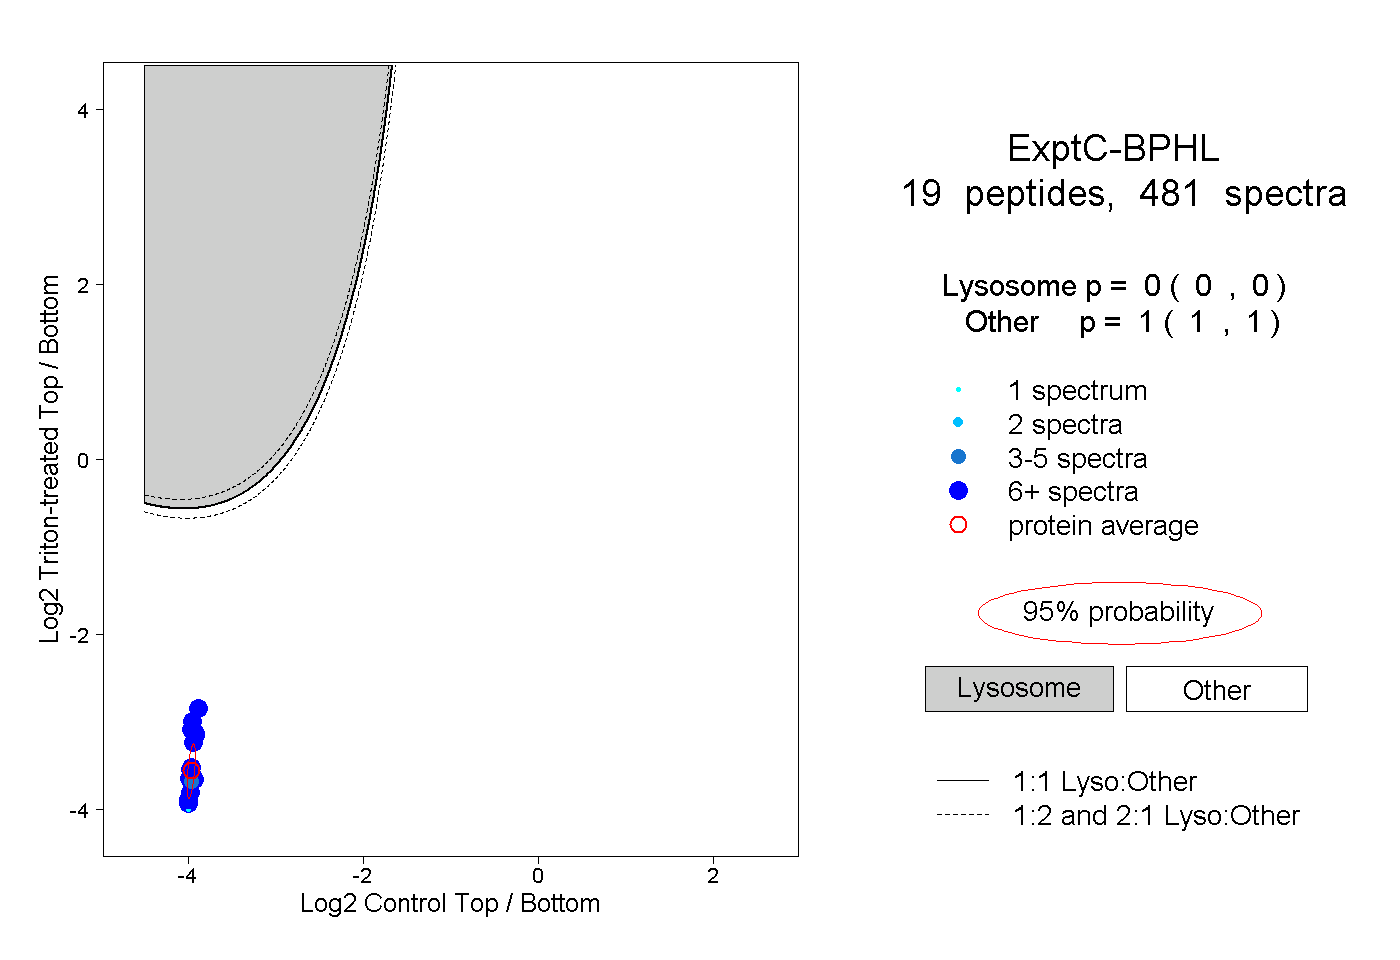
0.000 | 0.000
1.000 | 1.000
11peptides
spectra
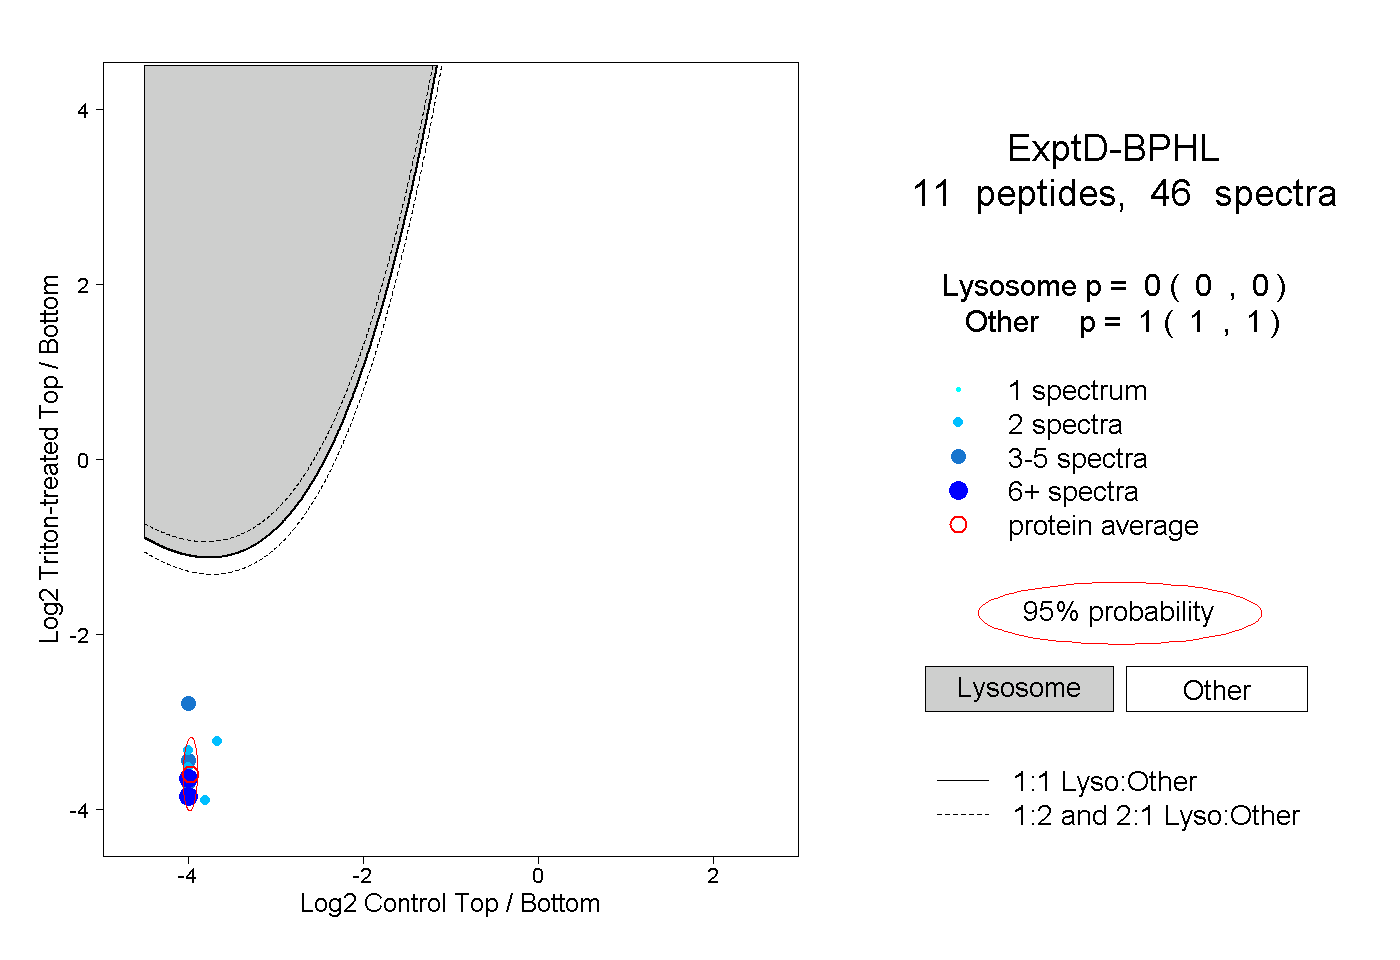
0.000 | 0.000
1.000 | 1.000