 11
11peptides
spectra
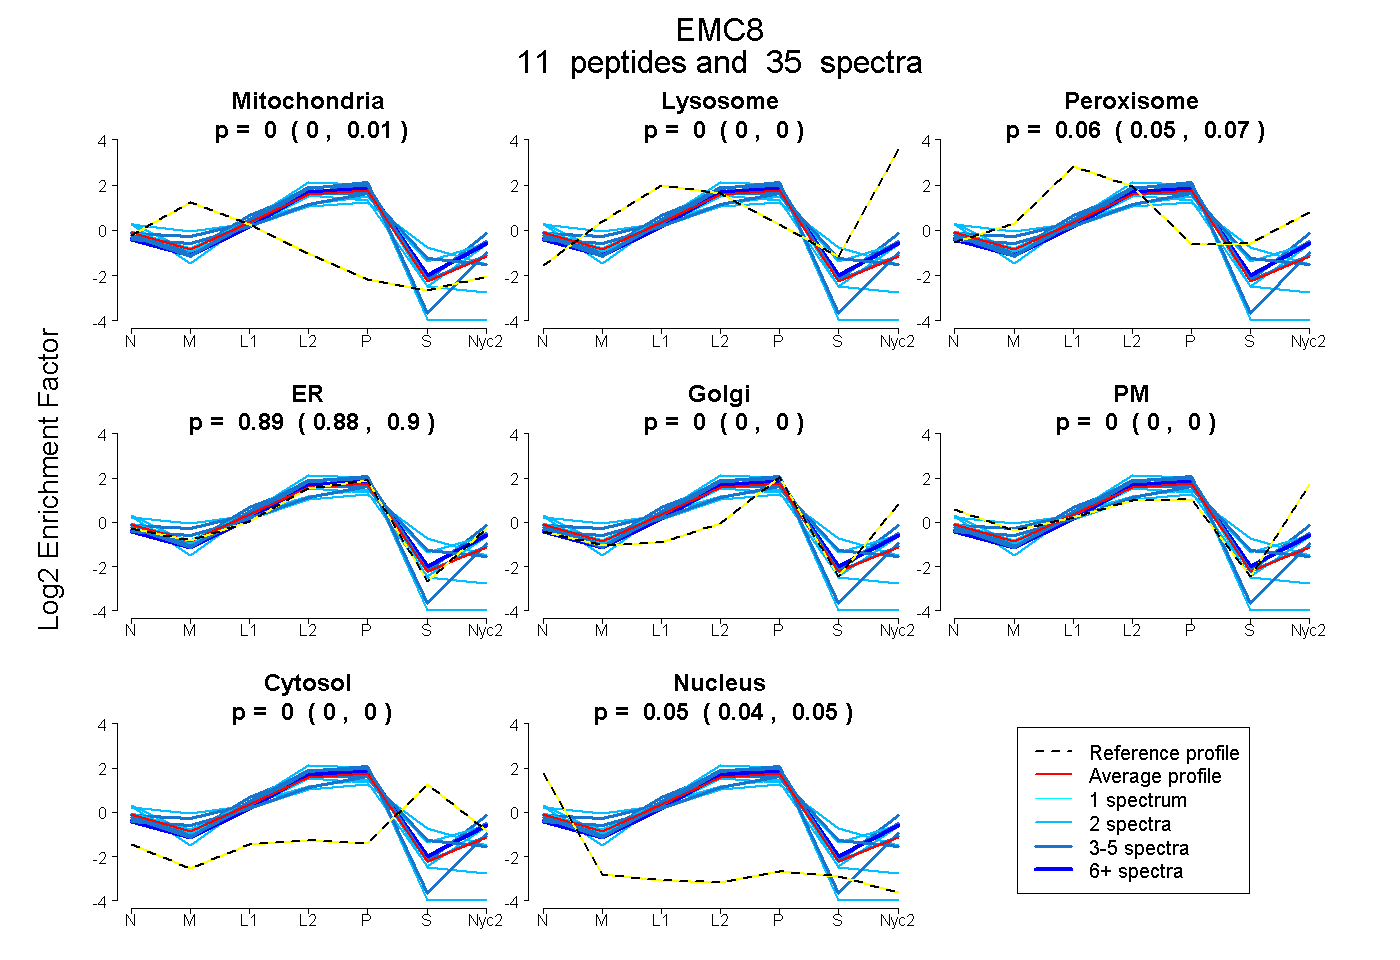
0.000 | 0.007
0.000 | 0.000
0.048 | 0.070
0.882 | 0.903
0.000 | 0.000
0.000 | 0.000
0.000 | 0.002
0.039 | 0.049
6peptides
spectra
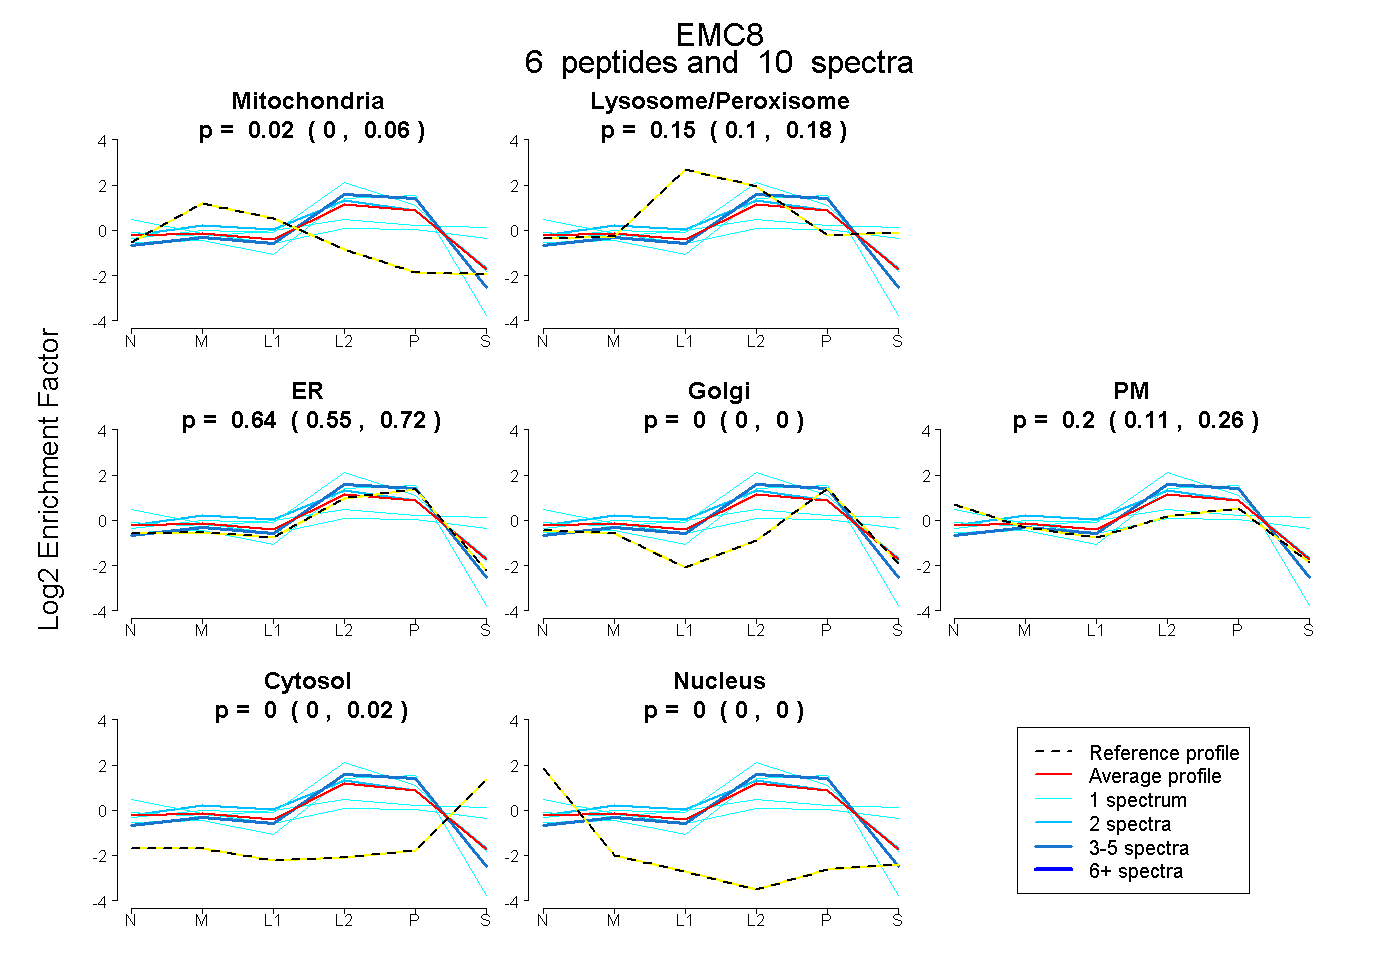
0.000 | 0.057
0.095 | 0.184
0.549 | 0.720
0.000 | 0.000
0.109 | 0.261
0.000 | 0.020
0.000 | 0.000
10peptides
spectra
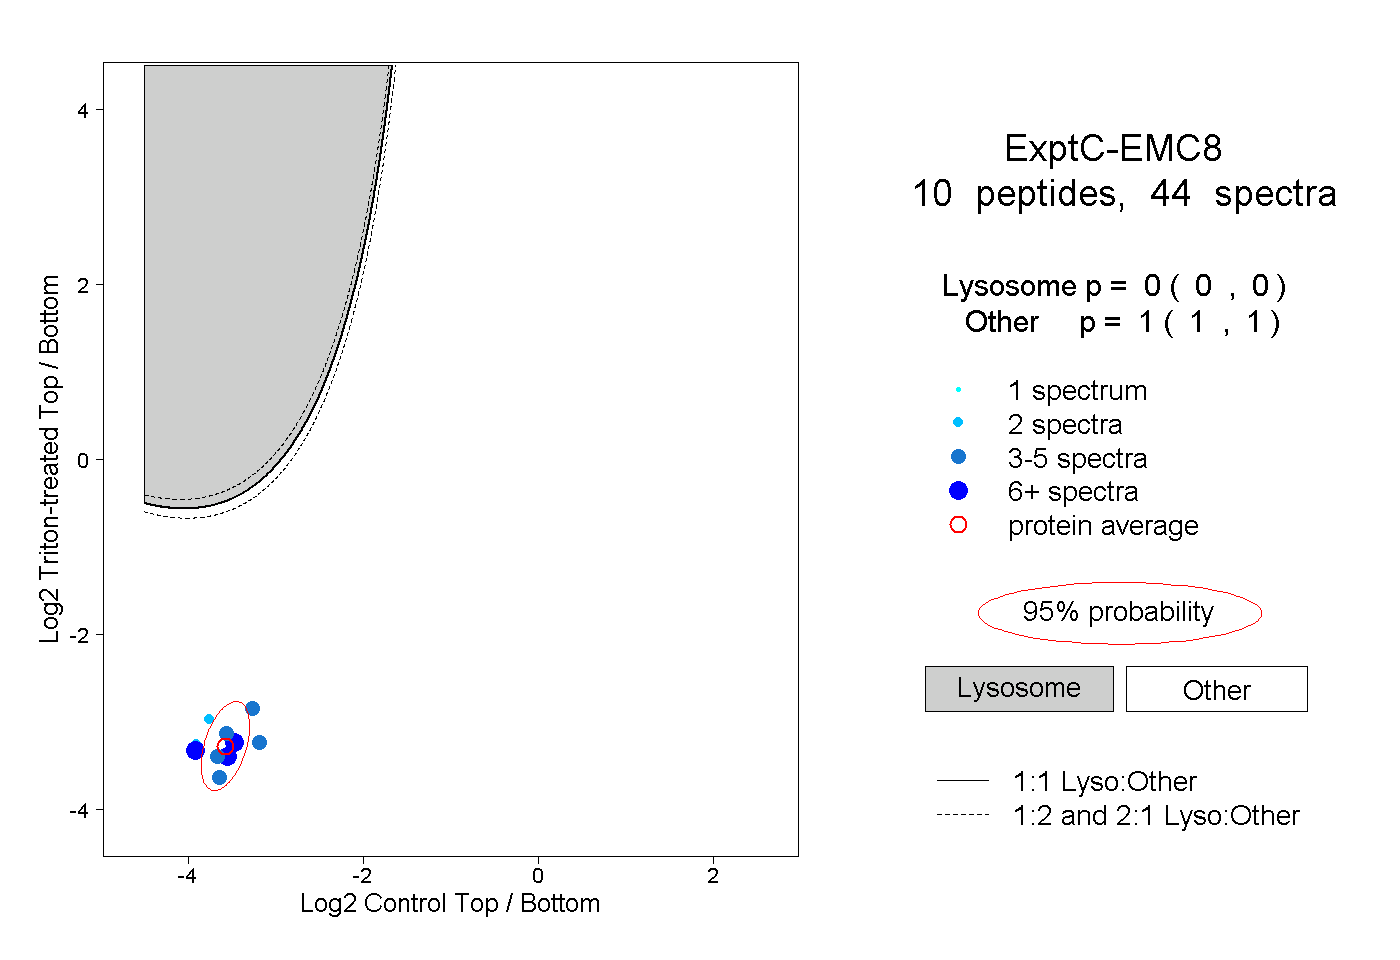
0.000 | 0.000
1.000 | 1.000
2peptides
spectra
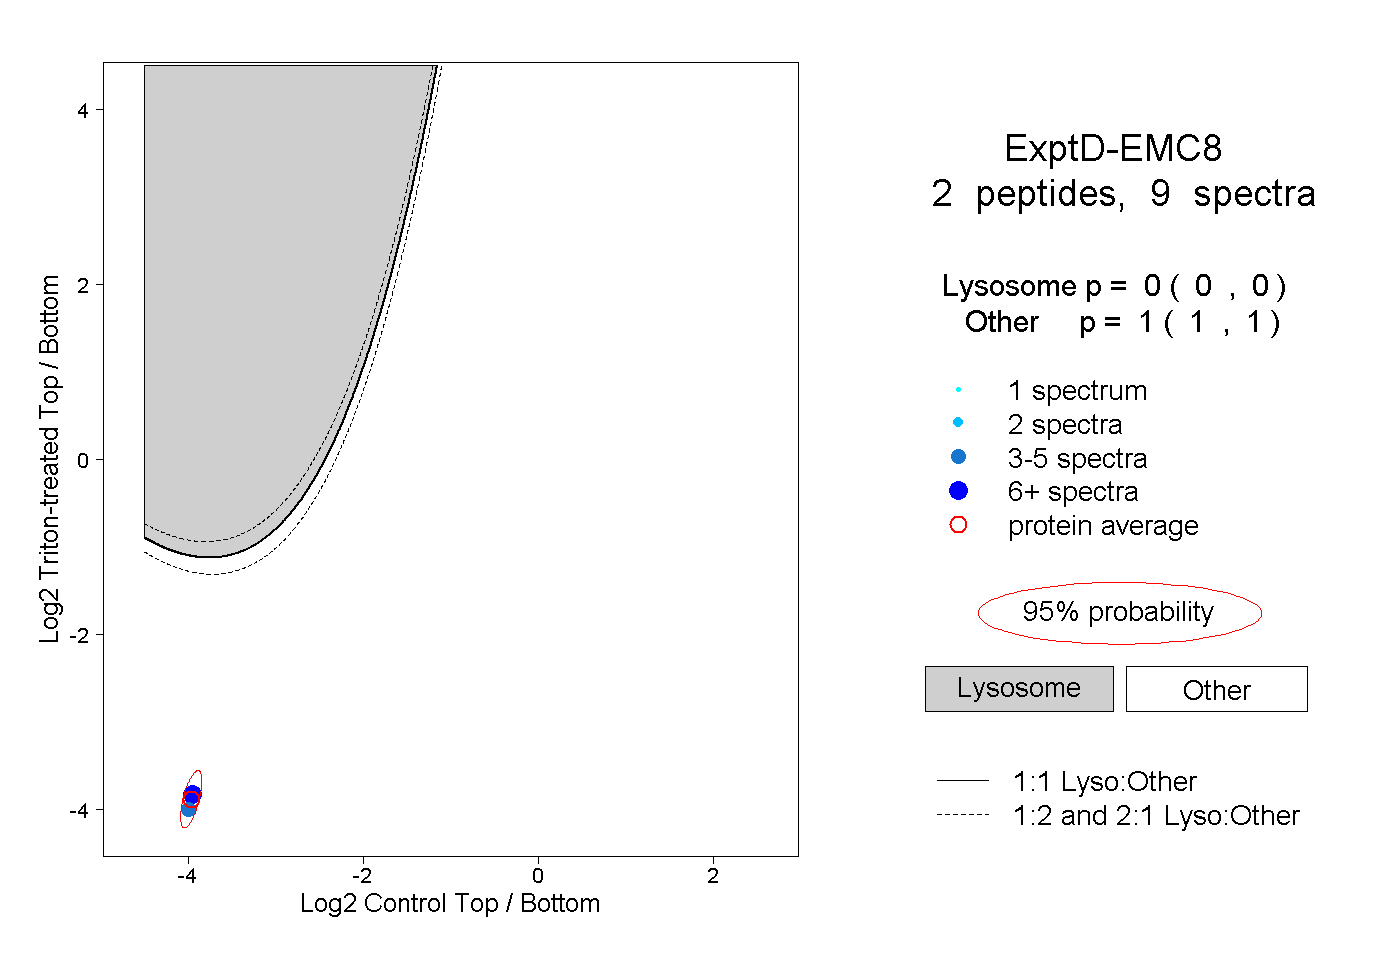
0.000 | 0.000
1.000 | 1.000