 11
11peptides
spectra
0.000 | 0.007
0.000 | 0.000
0.048 | 0.070
0.882 | 0.903
0.000 | 0.000
0.000 | 0.000
0.000 | 0.002
0.039 | 0.049
| Plot | Mito | Lyso | Perox | ER | Golgi | PM | Cytosol | Nucleus | |||||
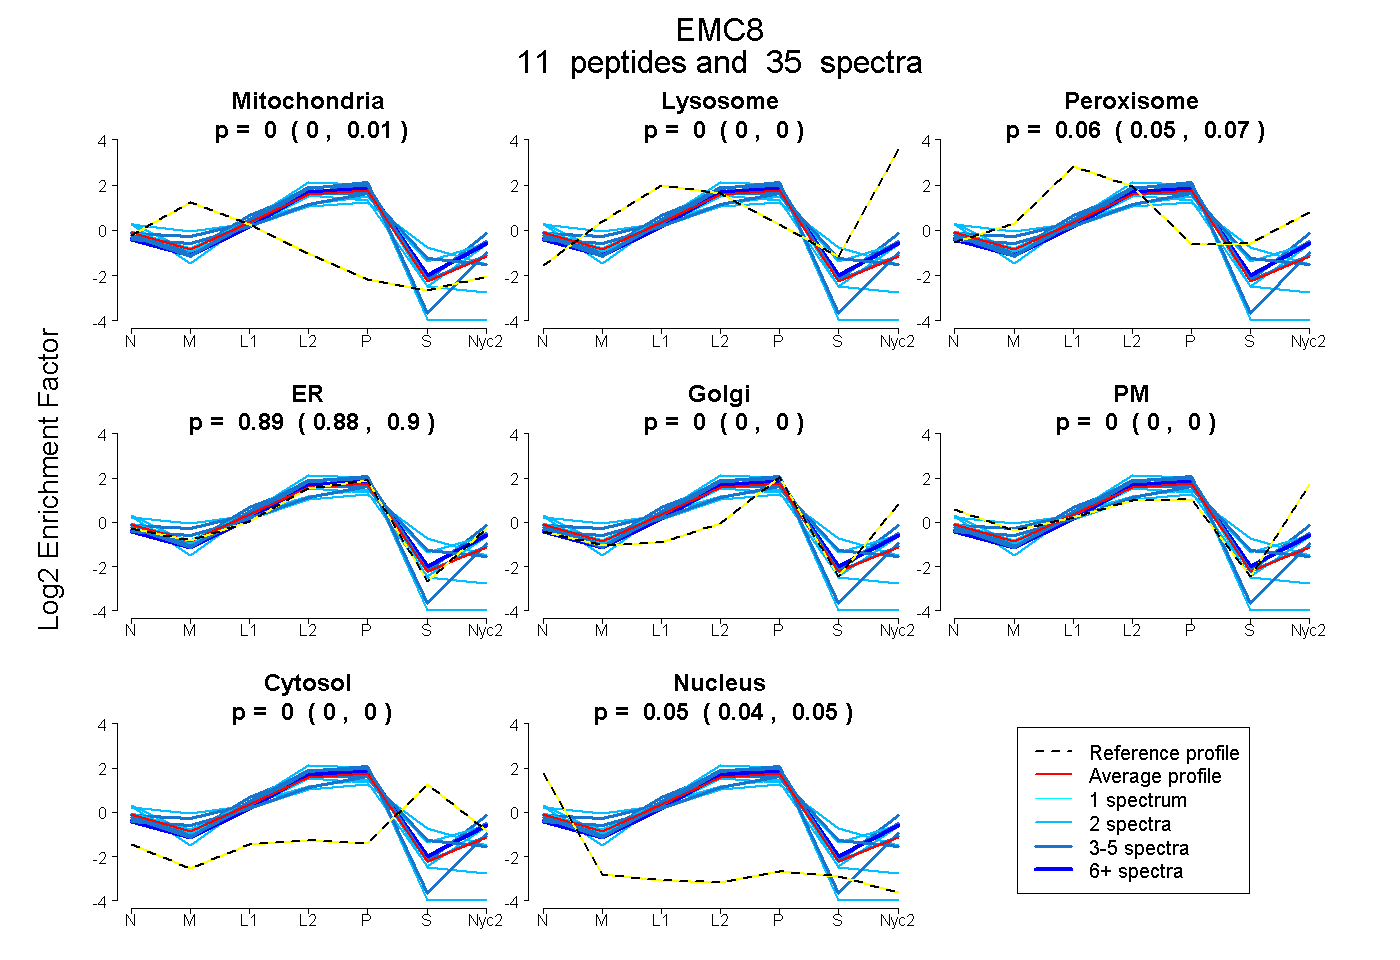
| Expt A |
11 peptides |
35 spectra |
|
0.000 0.000 | 0.007 |
0.000 0.000 | 0.000 |
0.062 0.048 | 0.070 |
0.893 0.882 | 0.903 |
0.000 0.000 | 0.000 |
0.000 0.000 | 0.000 |
0.000 0.000 | 0.002 |
0.045 0.039 | 0.049 |
| 4 spectra, SDWTNPEINK | 0.000 | 0.000 | 0.000 | 0.993 | 0.000 | 0.000 | 0.000 | 0.007 | ||
| 3 spectra, ISASLLDSR | 0.036 | 0.000 | 0.138 | 0.826 | 0.000 | 0.000 | 0.000 | 0.000 | ||
| 2 spectra, IAEGFSDAALIMVDNAK | 0.128 | 0.000 | 0.075 | 0.797 | 0.000 | 0.000 | 0.000 | 0.000 | ||
| 6 spectra, MVLHGAK | 0.000 | 0.000 | 0.034 | 0.899 | 0.000 | 0.000 | 0.067 | 0.000 | ||
| 5 spectra, DASPNQVAEK | 0.000 | 0.000 | 0.128 | 0.872 | 0.000 | 0.000 | 0.000 | 0.000 | ||
| 2 spectra, FTMDCAAPTIHVYEQHENR | 0.000 | 0.000 | 0.129 | 0.619 | 0.000 | 0.000 | 0.194 | 0.059 | ||
| 2 spectra, AVLHLC | 0.022 | 0.000 | 0.000 | 0.867 | 0.000 | 0.000 | 0.000 | 0.111 | ||
| 3 spectra, YPHCAVNGLLVAER | 0.057 | 0.000 | 0.038 | 0.747 | 0.000 | 0.000 | 0.158 | 0.000 | ||
| 4 spectra, SYETLVDFDNHLDDIR | 0.000 | 0.000 | 0.031 | 0.956 | 0.000 | 0.000 | 0.013 | 0.000 | ||
| 2 spectra, DNSYVIAGYYQANER | 0.000 | 0.000 | 0.096 | 0.733 | 0.000 | 0.000 | 0.154 | 0.017 | ||
| 2 spectra, LTTQAYCK | 0.050 | 0.000 | 0.000 | 0.849 | 0.000 | 0.000 | 0.000 | 0.101 |
| Plot | Mito | Lyso or Perox | ER | Golgi | PM | Cytosol | Nucleus | ||||||
| Expt B |
6 peptides |
10 spectra |
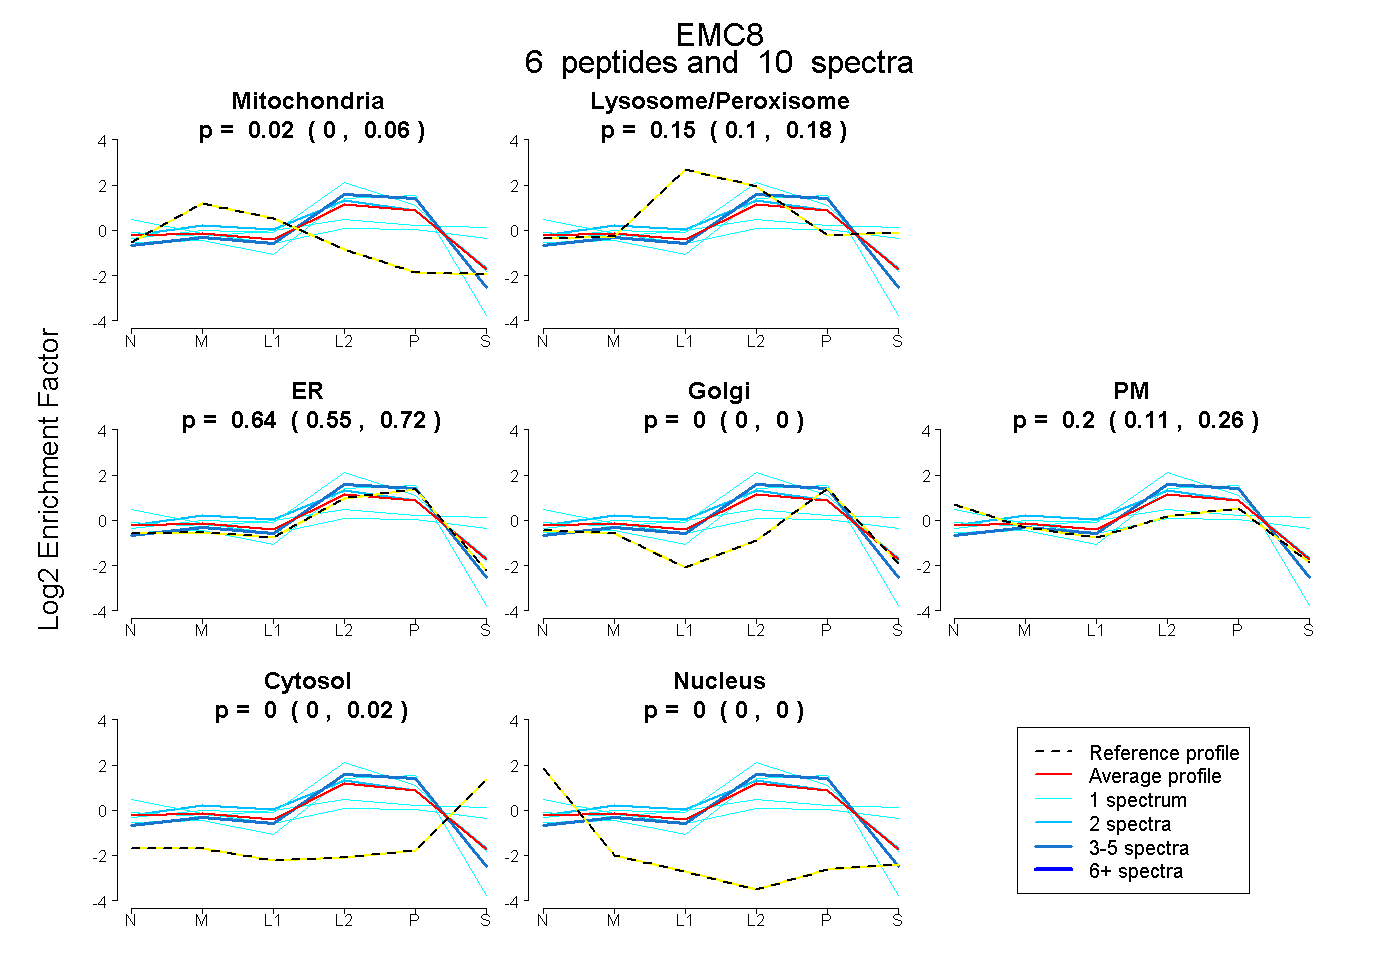 |
0.017 0.000 | 0.057 |
0.146 0.095 | 0.184 |
0.635 0.549 | 0.720 |
0.000 0.000 | 0.000 |
0.201 0.109 | 0.261 |
0.000 0.000 | 0.020 |
0.000 0.000 | 0.000 |
|||
| Plot | Lyso | Other | |||||||||||
| Expt C |
10 peptides |
44 spectra |
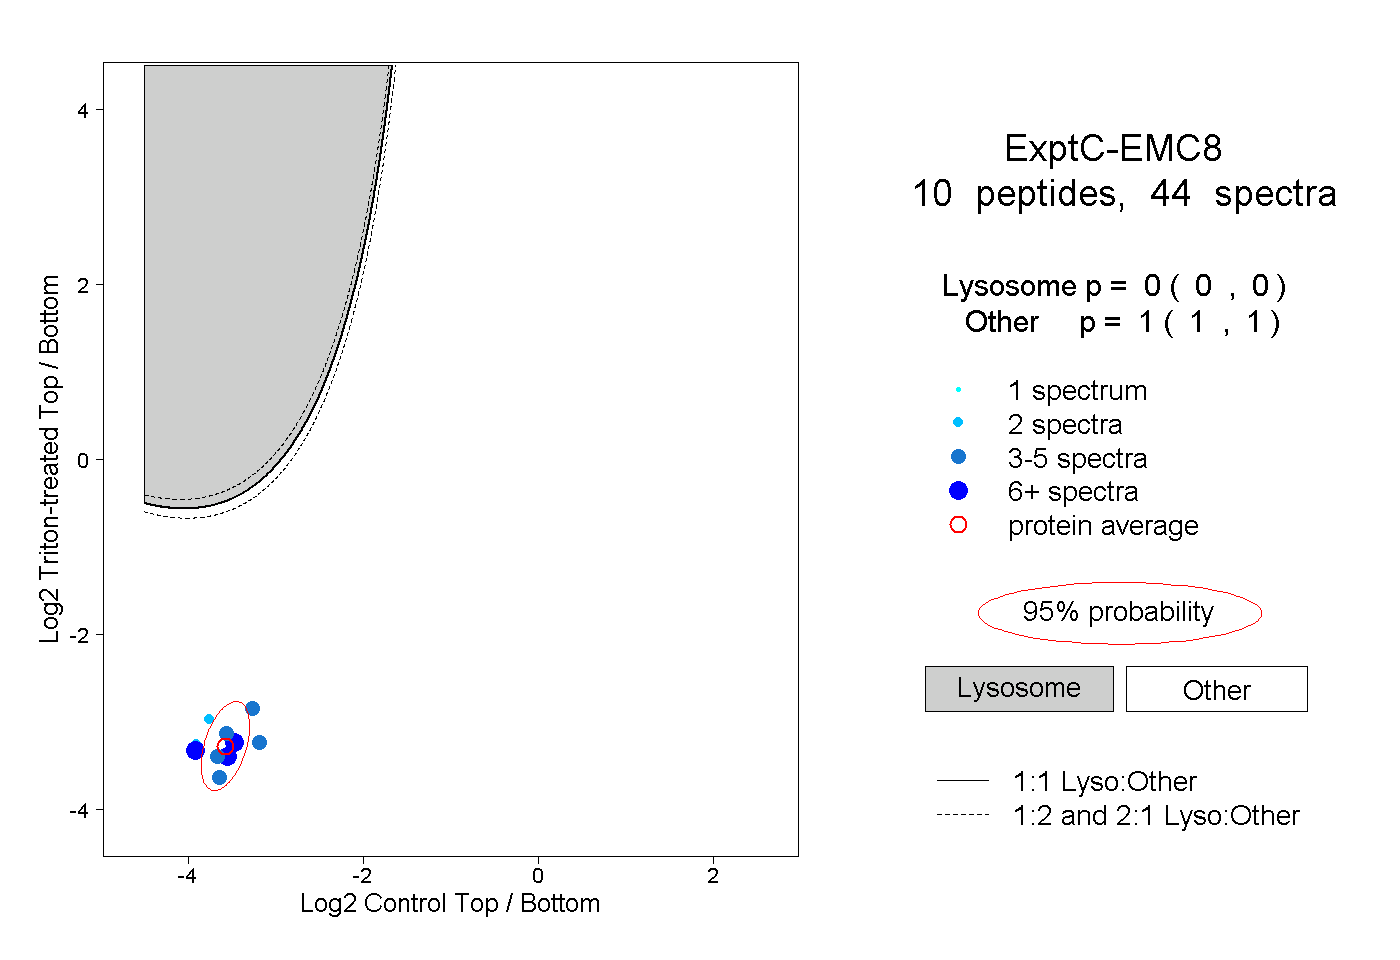 |
0.000 0.000 | 0.000 |
1.000 1.000 | 1.000 |
||||||||
| Plot | Lyso | Other | |||||||||||
| Expt D |
2 peptides |
9 spectra |
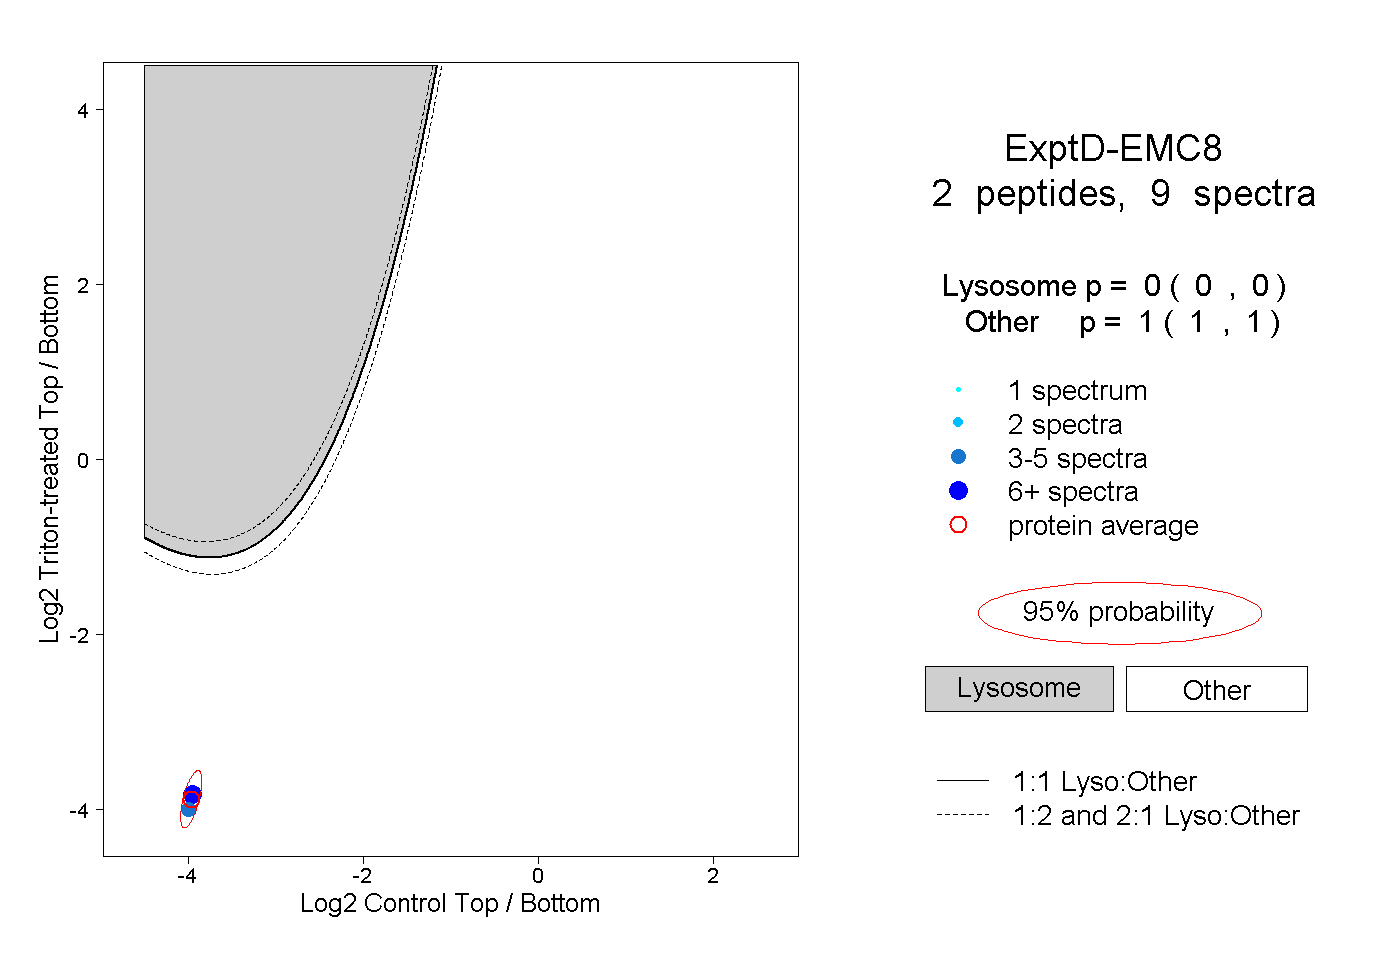 |
0.000 0.000 | 0.000 |
1.000 1.000 | 1.000 |