 6
6peptides
spectra
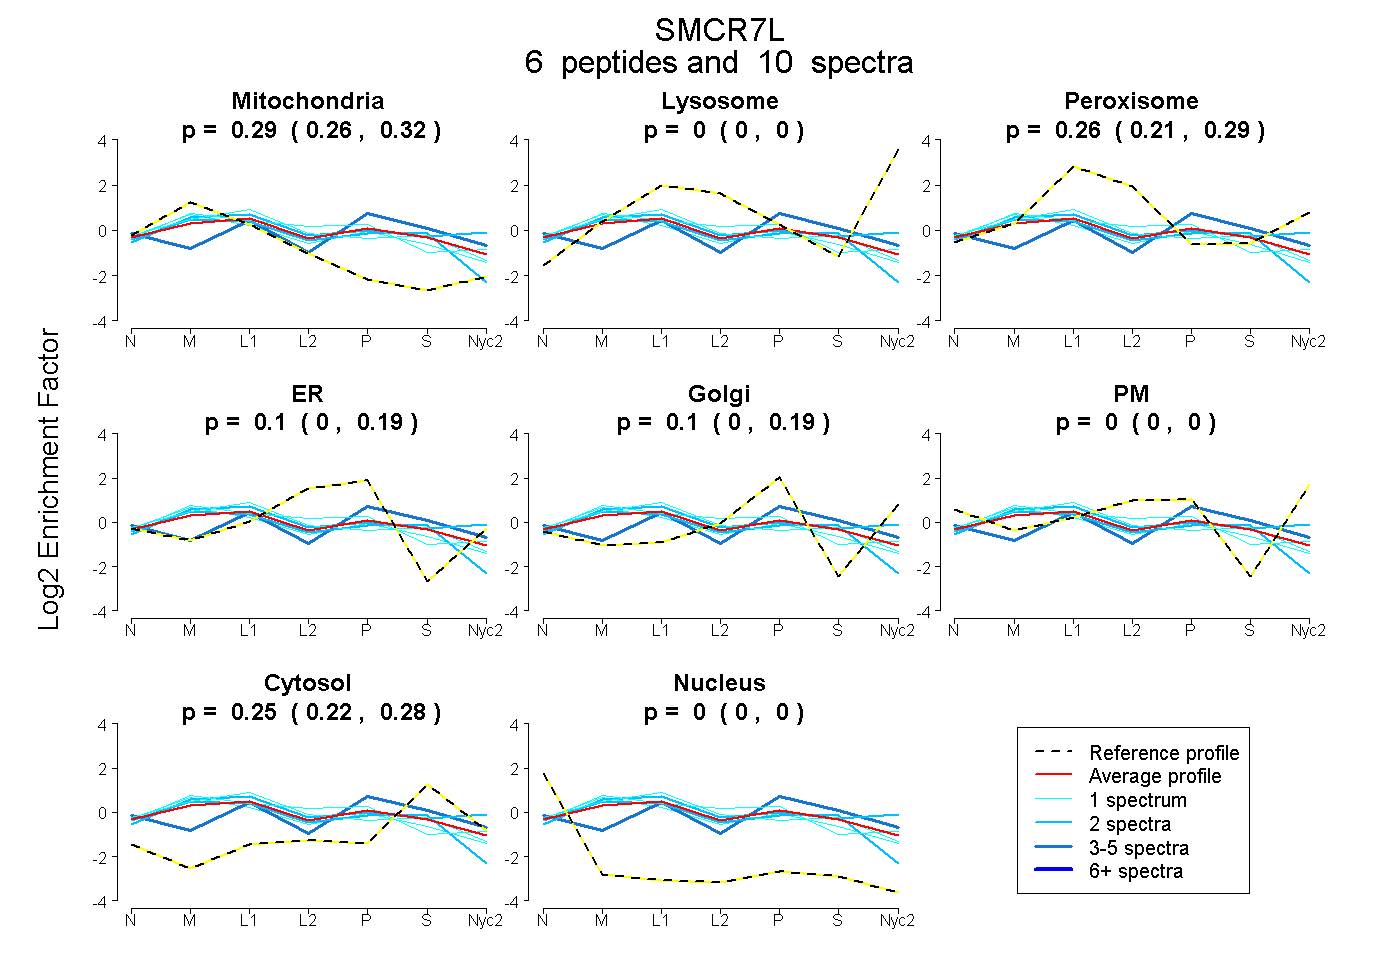
0.261 | 0.316
0.000 | 0.000
0.211 | 0.289
0.000 | 0.194
0.000 | 0.186
0.000 | 0.000
0.223 | 0.281
0.000 | 0.000
2peptides
spectra
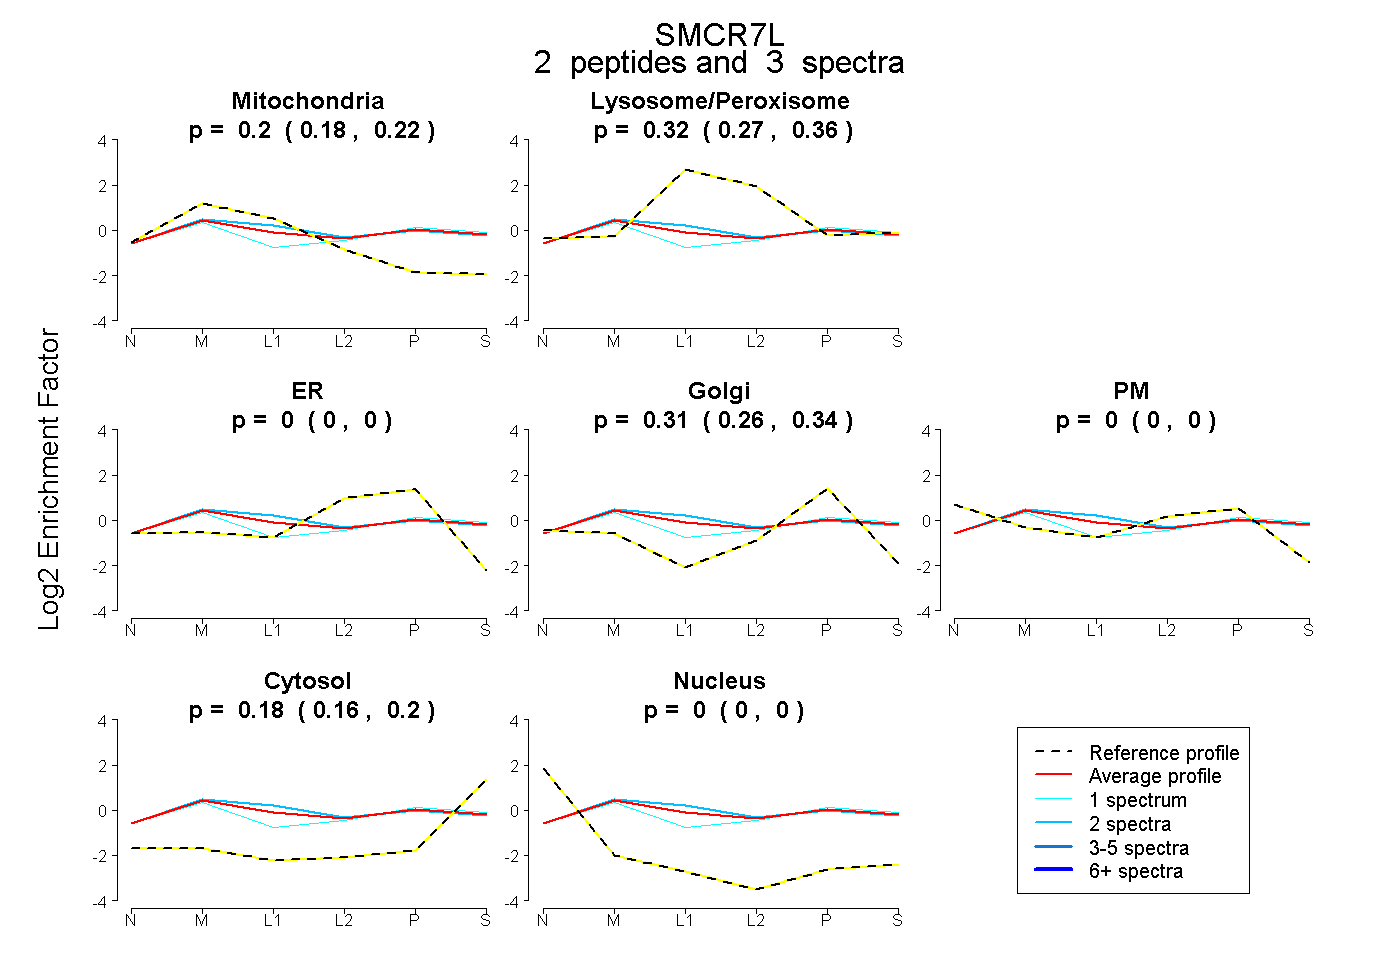
0.178 | 0.219
0.267 | 0.355
0.000 | 0.000
0.260 | 0.343
0.000 | 0.000
0.156 | 0.196
0.000 | 0.000
11peptides
spectra
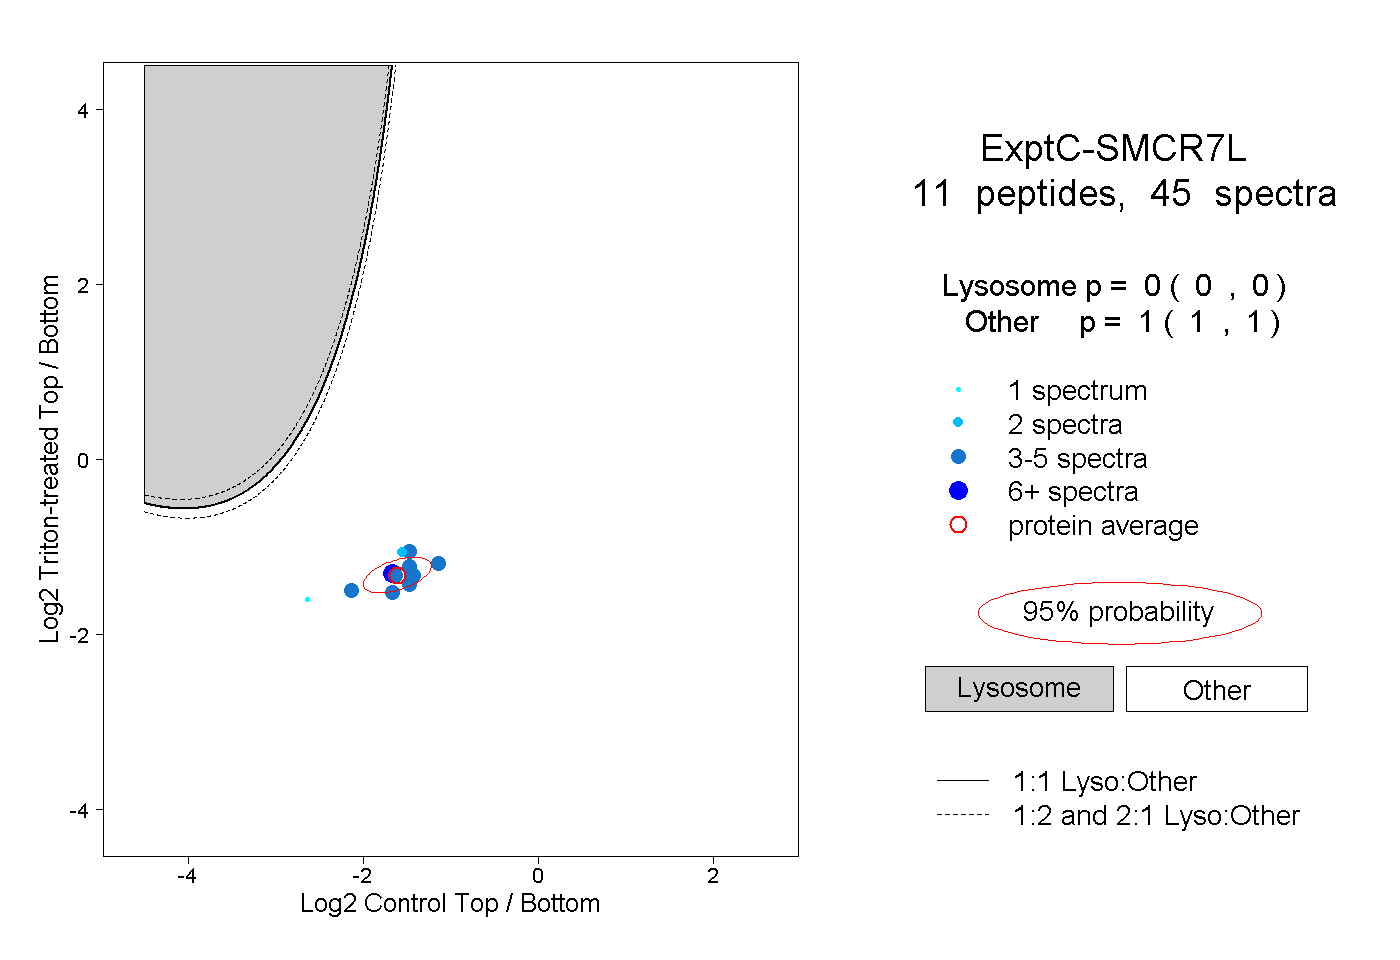
0.000 | 0.000
1.000 | 1.000
2peptides
spectra
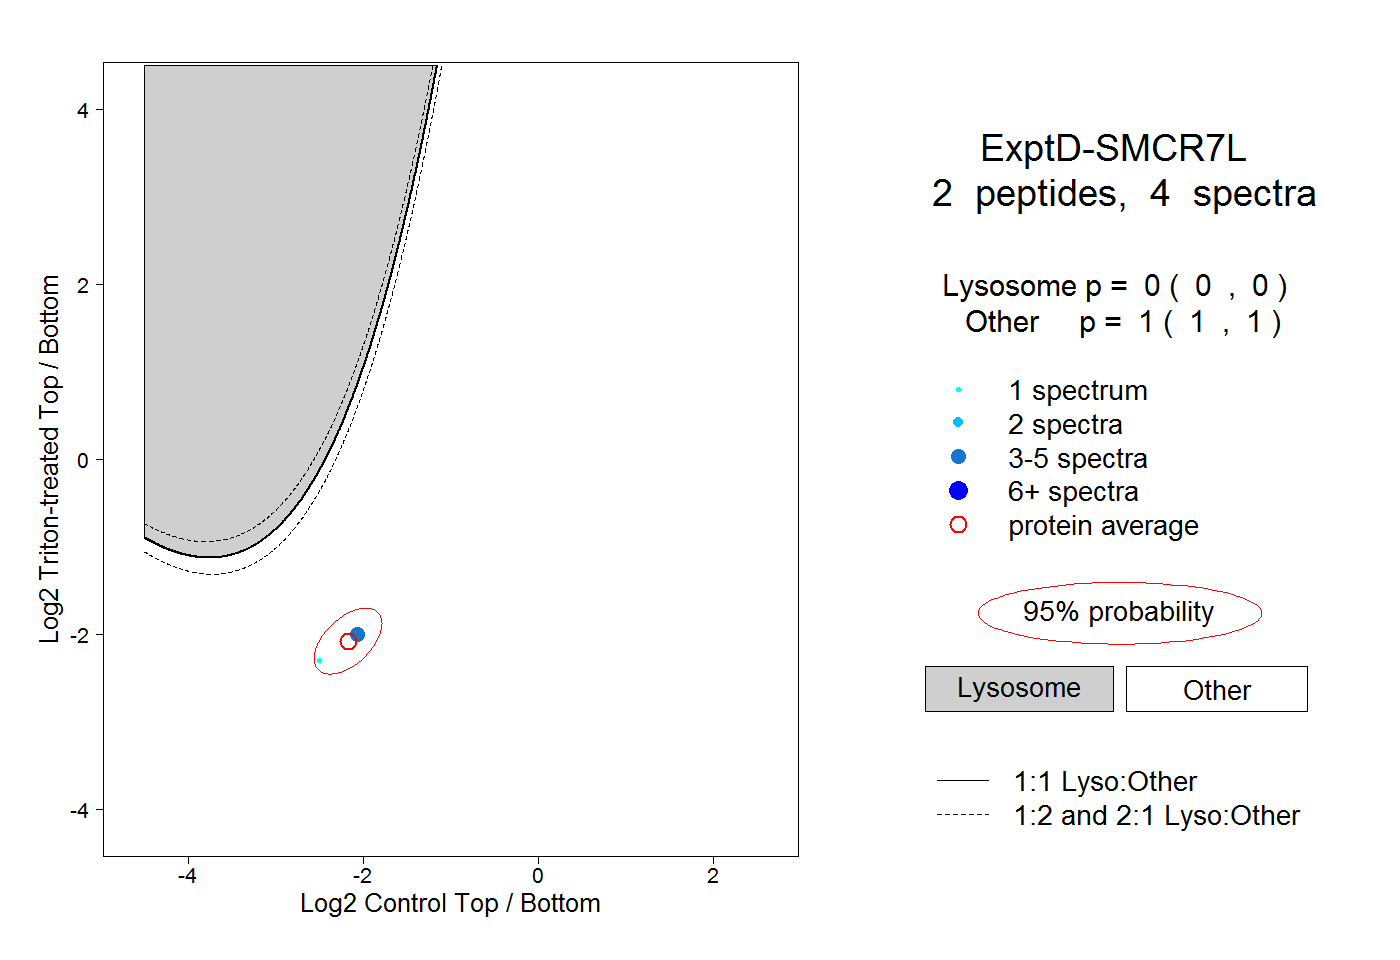
0.000 | 0.000
1.000 | 1.000