 6
6peptides
spectra
0.261 | 0.316
0.000 | 0.000
0.211 | 0.289
0.000 | 0.194
0.000 | 0.186
0.000 | 0.000
0.223 | 0.281
0.000 | 0.000
| Plot | Mito | Lyso | Perox | ER | Golgi | PM | Cytosol | Nucleus | |||||
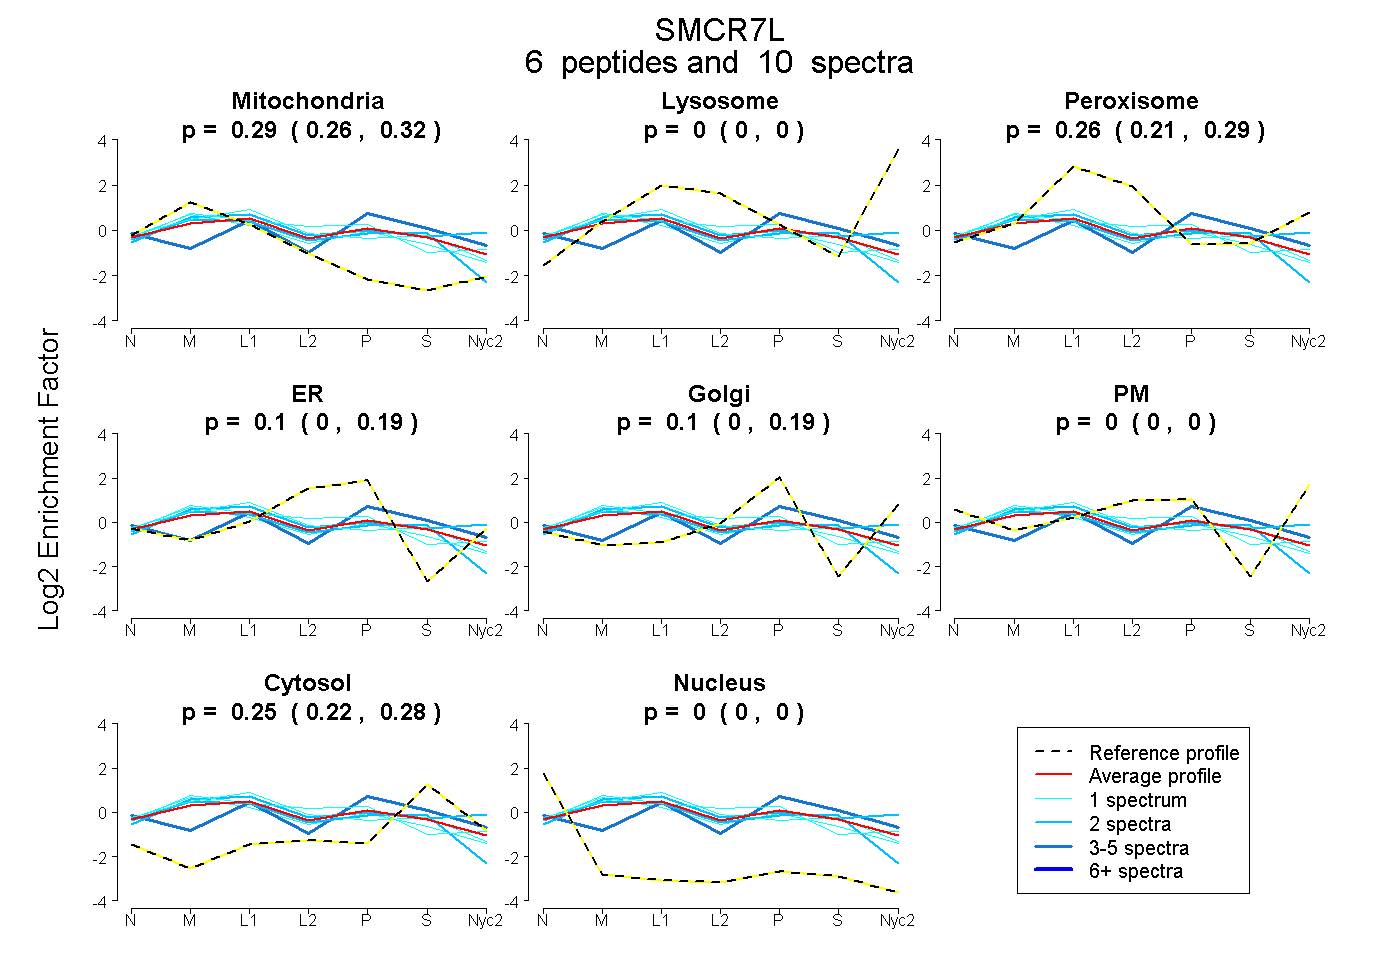
| Expt A |
6 peptides |
10 spectra |
|
0.291 0.261 | 0.316 |
0.000 0.000 | 0.000 |
0.256 0.211 | 0.289 |
0.098 0.000 | 0.194 |
0.102 0.000 | 0.186 |
0.000 0.000 | 0.000 |
0.254 0.223 | 0.281 |
0.000 0.000 | 0.000 |
| 1 spectrum, AAIPAGEQAR | 0.432 | 0.000 | 0.147 | 0.125 | 0.083 | 0.000 | 0.213 | 0.000 | ||
| 1 spectrum, QAAVDICAELR | 0.347 | 0.000 | 0.340 | 0.083 | 0.000 | 0.000 | 0.230 | 0.000 | ||
| 1 spectrum, LSLRPAETAR | 0.328 | 0.000 | 0.249 | 0.191 | 0.135 | 0.000 | 0.097 | 0.000 | ||
| 2 spectra, LPDMPLR | 0.226 | 0.056 | 0.345 | 0.000 | 0.174 | 0.000 | 0.199 | 0.000 | ||
| 2 spectra, ALDQADSGCR | 0.436 | 0.000 | 0.128 | 0.147 | 0.000 | 0.000 | 0.289 | 0.000 | ||
| 3 spectra, AISAPTSPTR | 0.084 | 0.000 | 0.219 | 0.000 | 0.316 | 0.000 | 0.381 | 0.000 |
| Plot | Mito | Lyso or Perox | ER | Golgi | PM | Cytosol | Nucleus | ||||||
| Expt B |
2 peptides |
3 spectra |
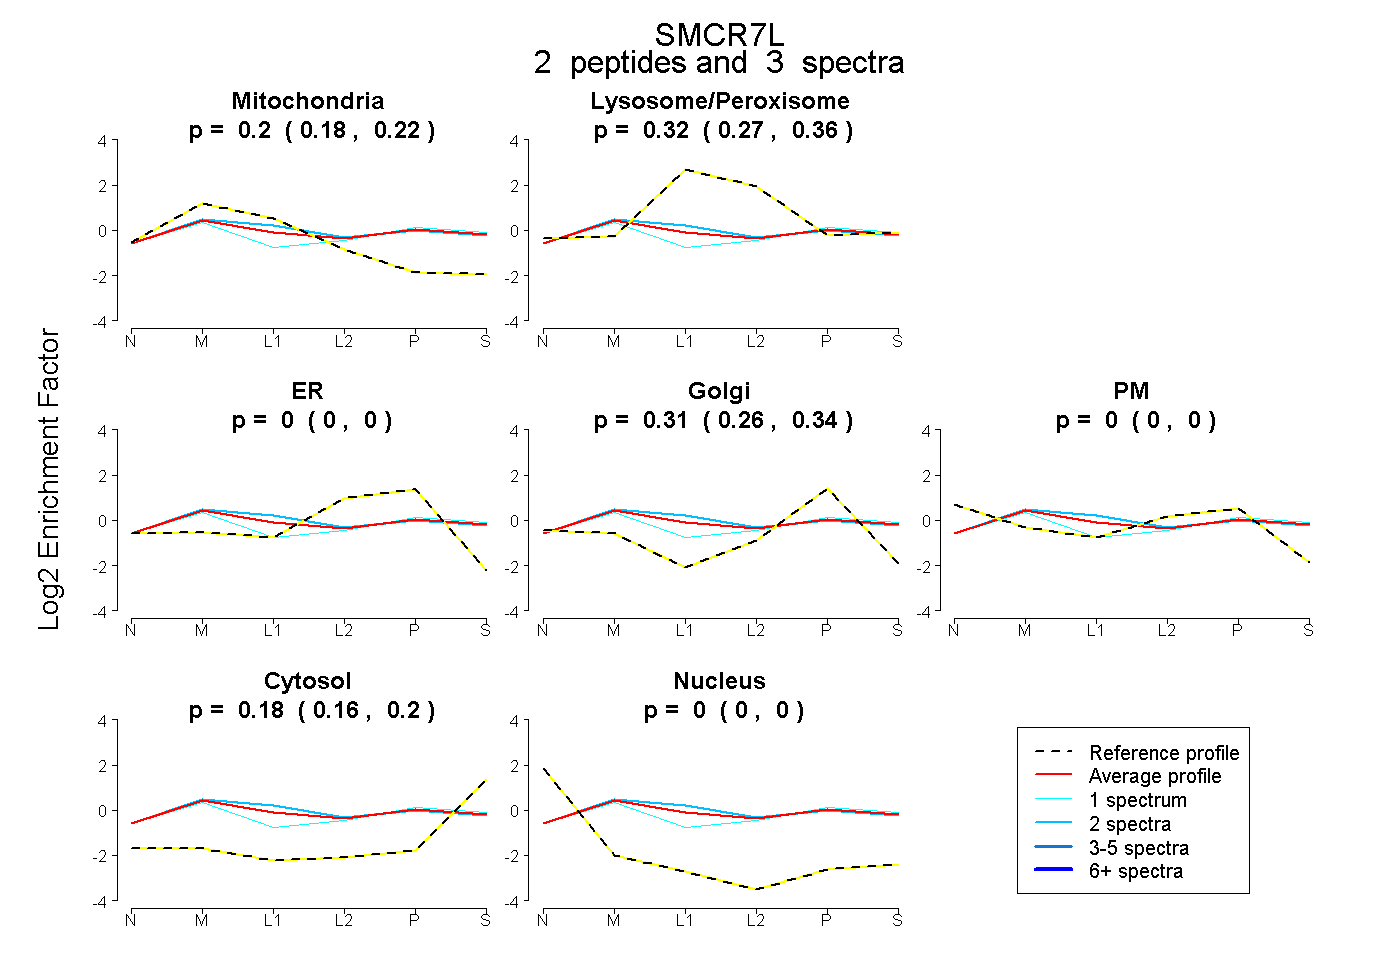 |
0.201 0.178 | 0.219 |
0.316 0.267 | 0.355 |
0.000 0.000 | 0.000 |
0.305 0.260 | 0.343 |
0.000 0.000 | 0.000 |
0.177 0.156 | 0.196 |
0.000 0.000 | 0.000 |
|||
| Plot | Lyso | Other | |||||||||||
| Expt C |
11 peptides |
45 spectra |
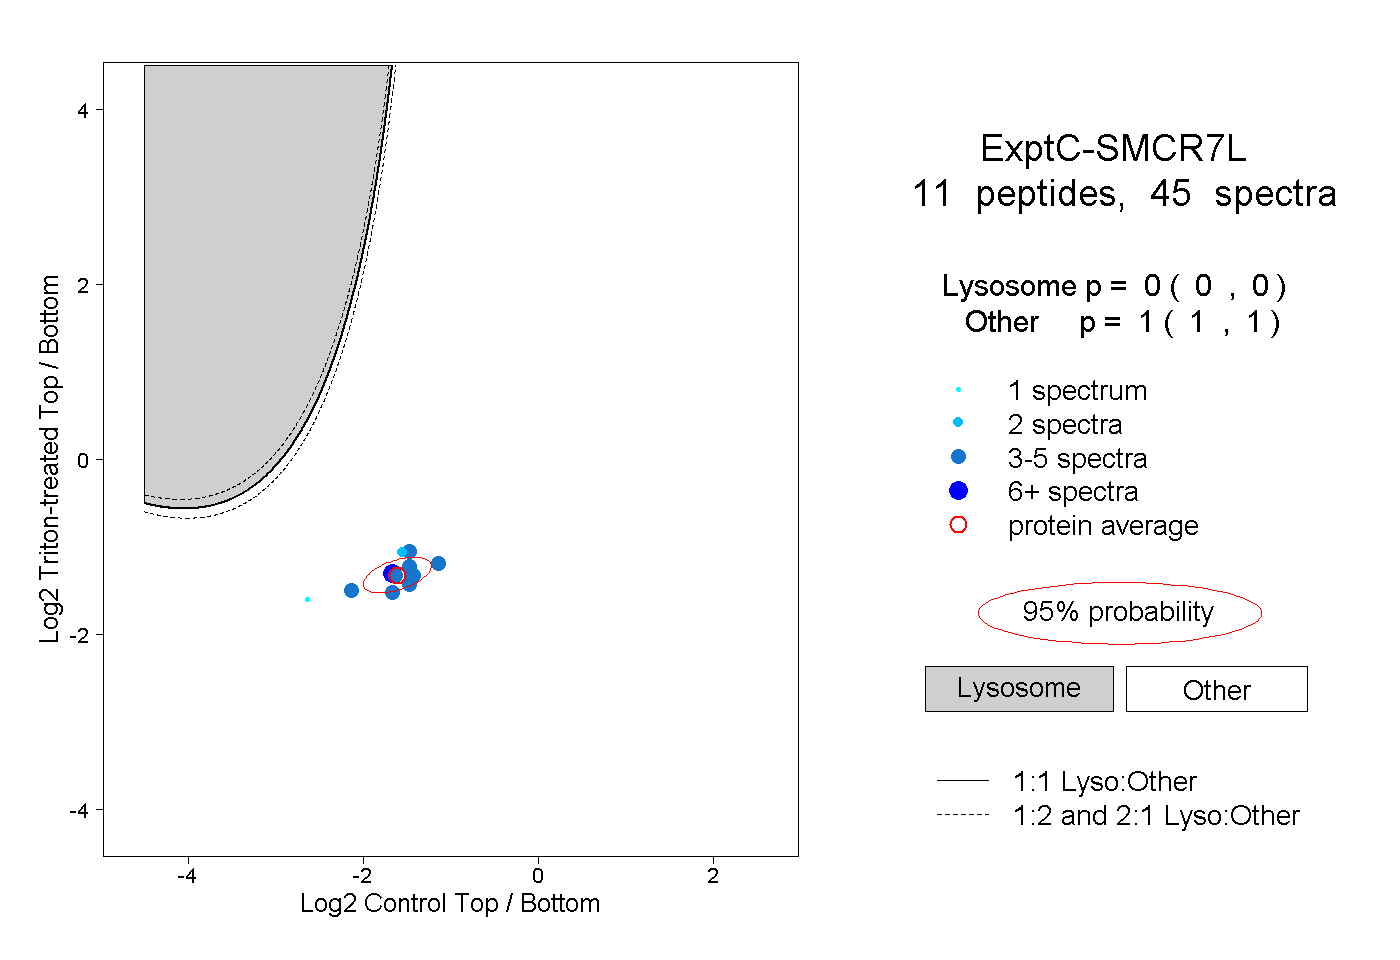 |
0.000 0.000 | 0.000 |
1.000 1.000 | 1.000 |
||||||||
| Plot | Lyso | Other | |||||||||||
| Expt D |
2 peptides |
4 spectra |
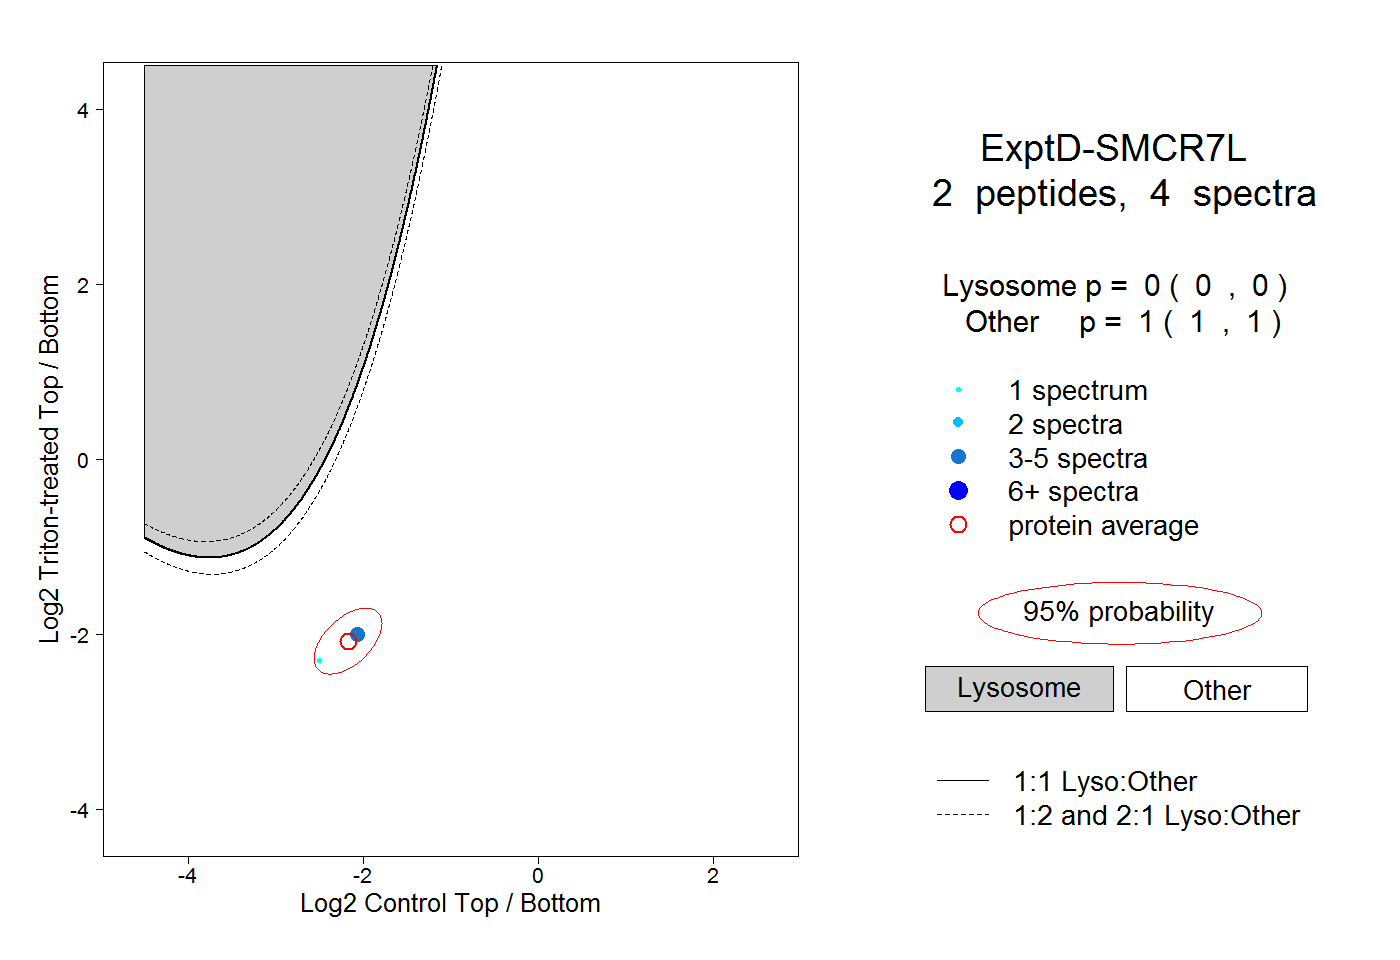 |
0.000 0.000 | 0.000 |
1.000 1.000 | 1.000 |