 13
13peptides
spectra
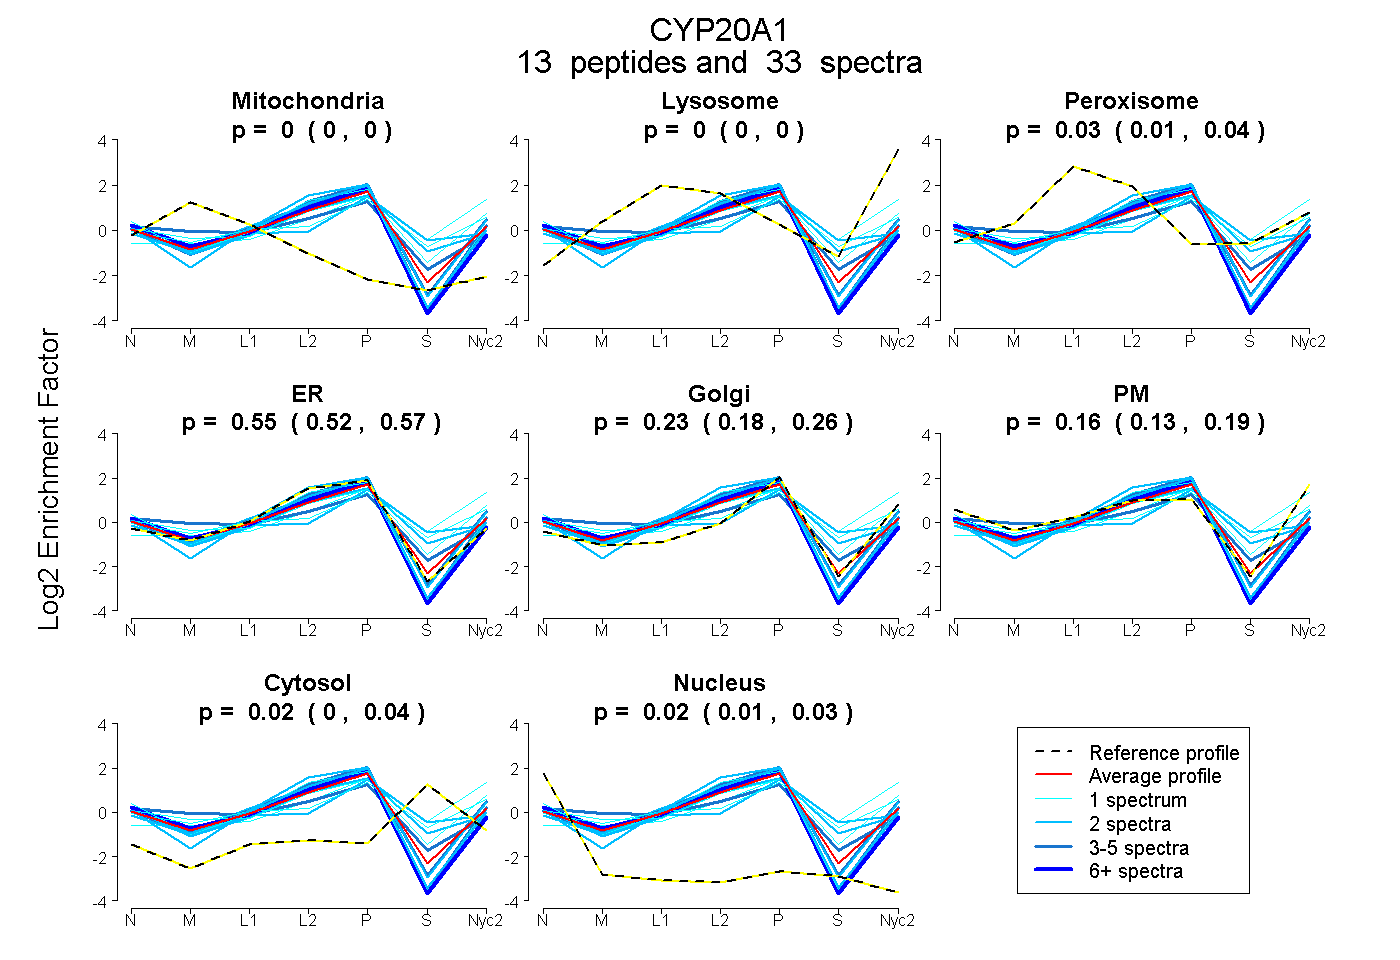
0.000 | 0.000
0.000 | 0.000
0.009 | 0.042
0.518 | 0.571
0.178 | 0.262
0.132 | 0.190
0.000 | 0.040
0.008 | 0.030
5peptides
spectra
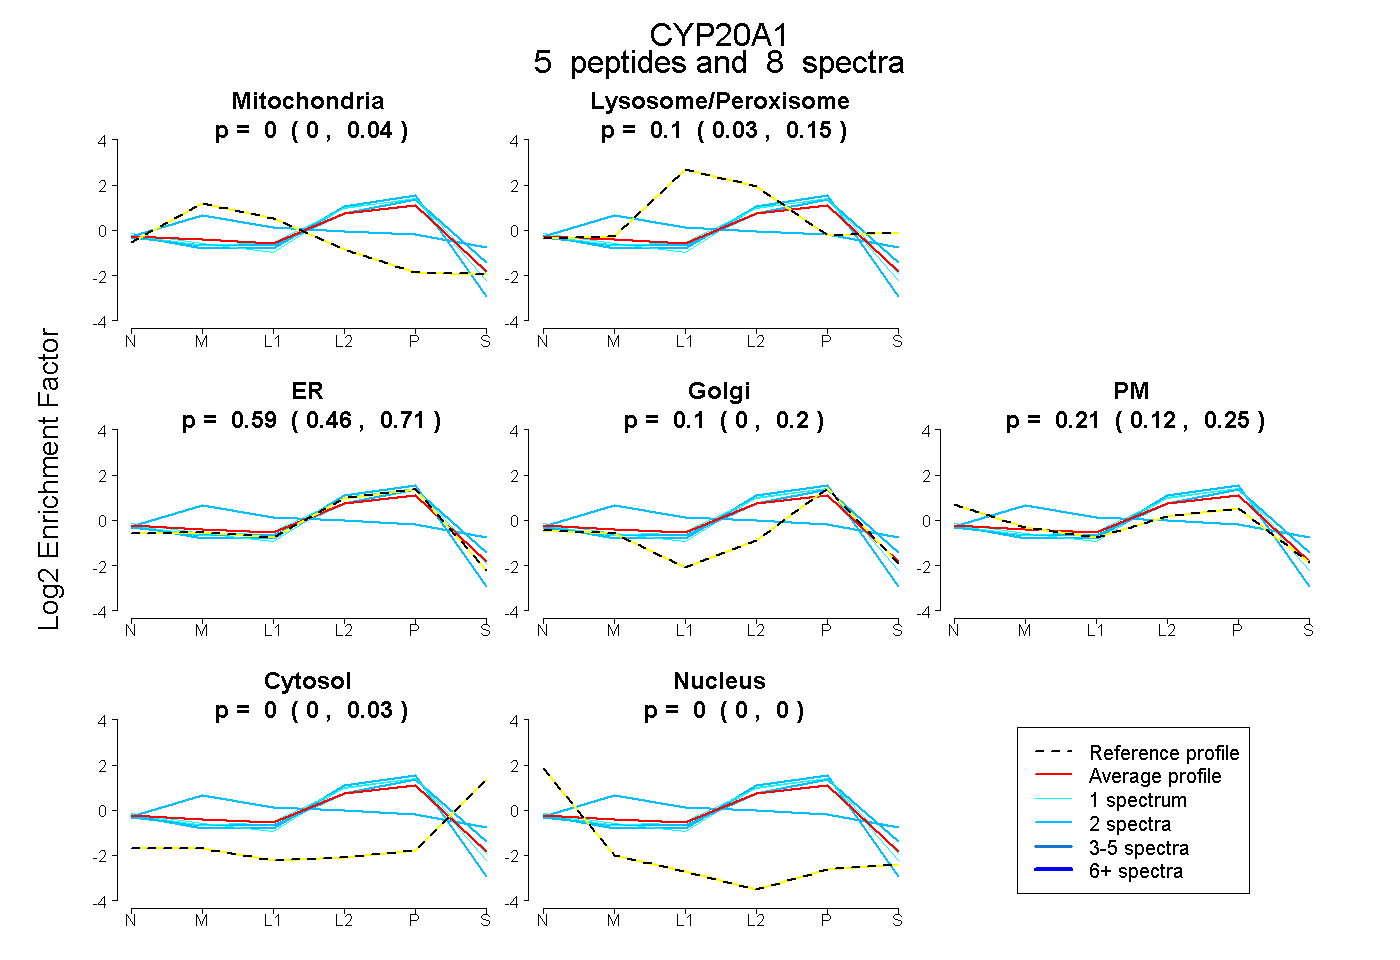
0.000 | 0.037
0.032 | 0.154
0.465 | 0.709
0.000 | 0.200
0.124 | 0.253
0.000 | 0.027
0.000 | 0.003
9peptides
spectra
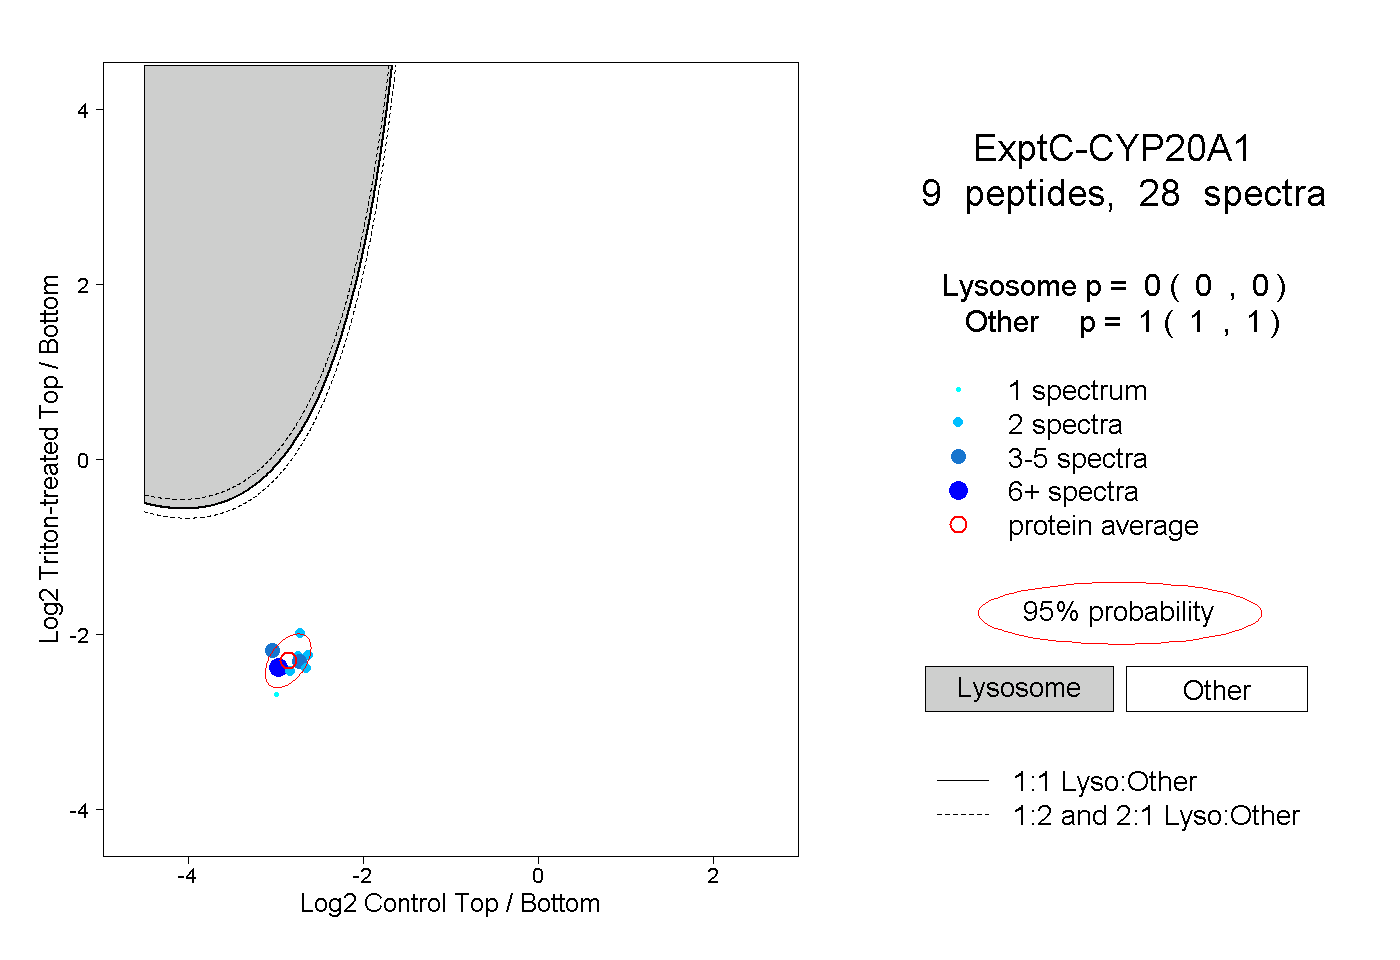
0.000 | 0.000
1.000 | 1.000
4peptides
spectra
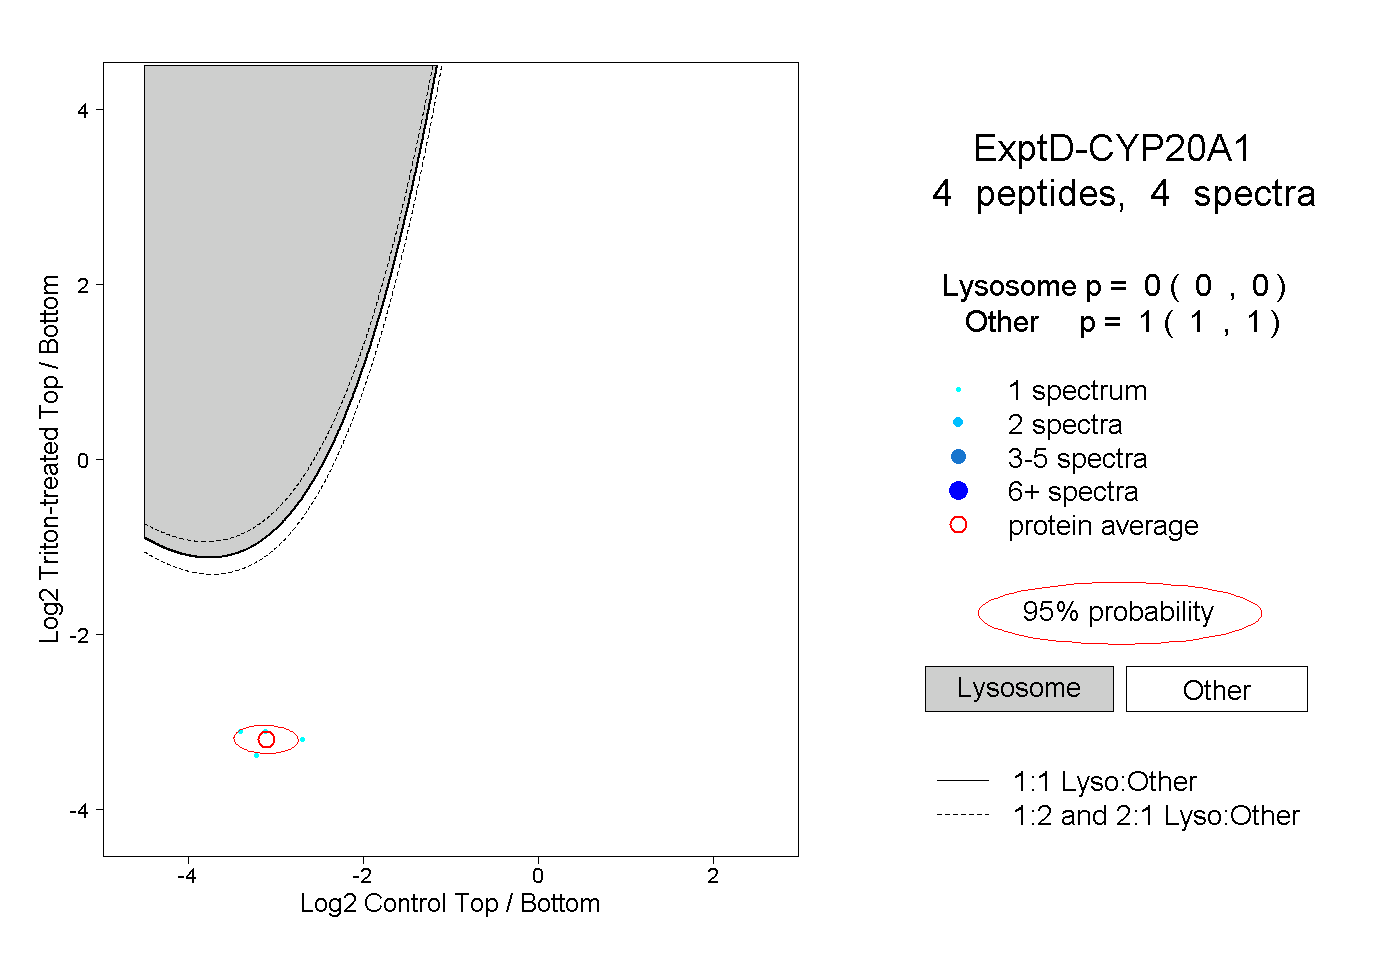
0.000 | 0.000
1.000 | 1.000