 13
13peptides
spectra
0.000 | 0.000
0.000 | 0.000
0.009 | 0.042
0.518 | 0.571
0.178 | 0.262
0.132 | 0.190
0.000 | 0.040
0.008 | 0.030
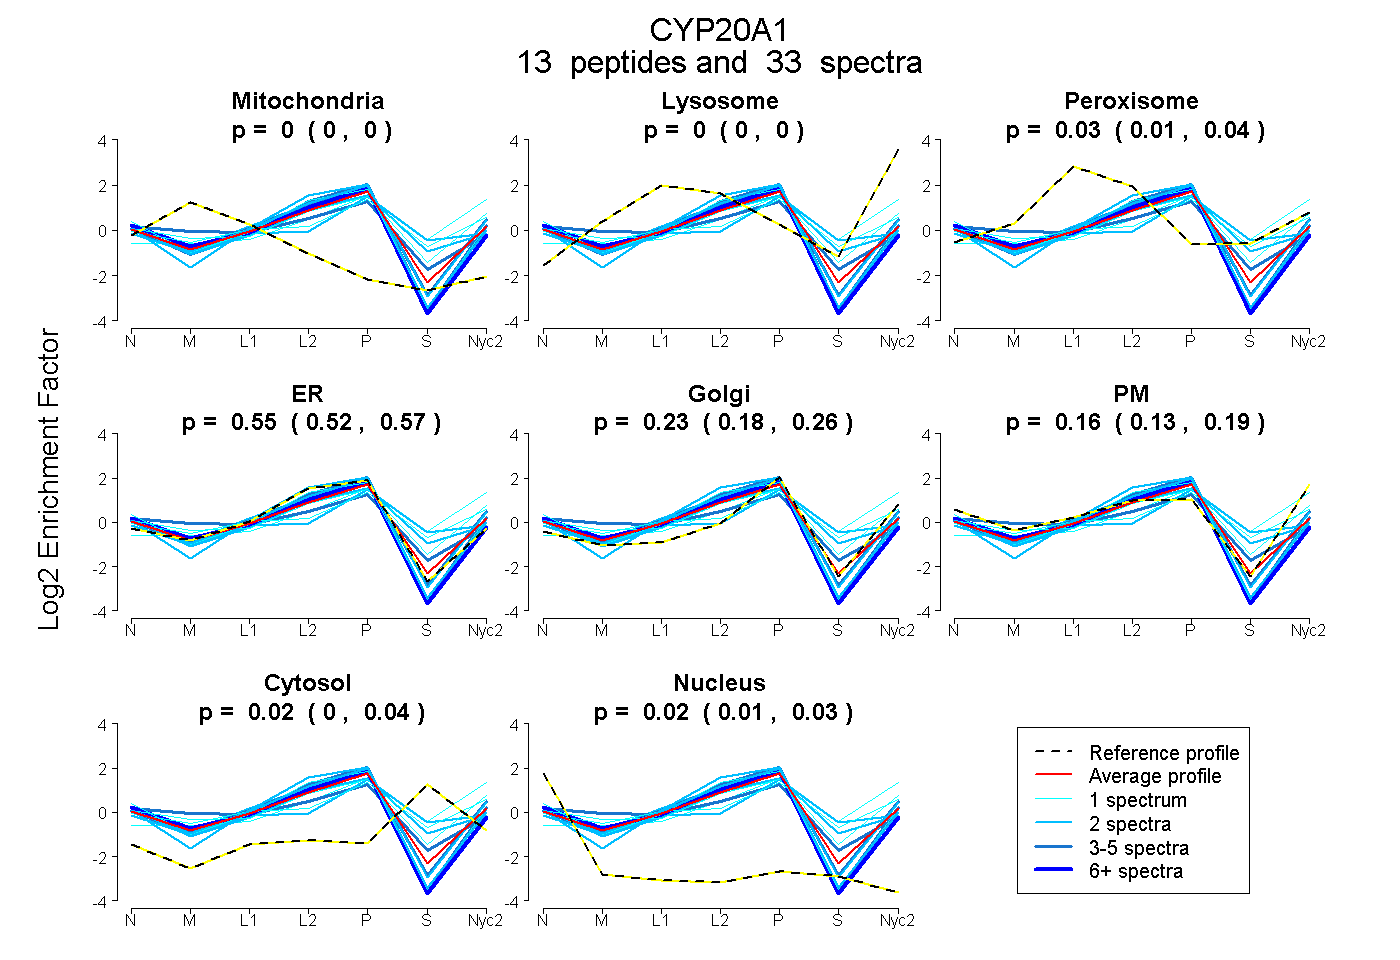
| Plot | Mito | Lyso | Perox | ER | Golgi | PM | Cytosol | Nucleus | |||||
| Expt A |
13 peptides |
33 spectra |
|
0.000 0.000 | 0.000 |
0.000 0.000 | 0.000 |
0.029 0.009 | 0.042 |
0.546 0.518 | 0.571 |
0.228 0.178 | 0.262 |
0.160 0.132 | 0.190 |
0.015 0.000 | 0.040 |
0.022 0.008 | 0.030 |
| 2 spectra, TLDPFETMLK | 0.000 | 0.000 | 0.000 | 0.748 | 0.092 | 0.160 | 0.000 | 0.000 | ||
| 2 spectra, IHGTVWSEIGK | 0.000 | 0.000 | 0.138 | 0.190 | 0.402 | 0.000 | 0.270 | 0.000 | ||
| 2 spectra, SLLGYR | 0.000 | 0.000 | 0.000 | 0.819 | 0.058 | 0.104 | 0.000 | 0.019 | ||
| 10 spectra, LSEELLDK | 0.000 | 0.000 | 0.000 | 0.820 | 0.023 | 0.105 | 0.000 | 0.052 | ||
| 2 spectra, LHLLAVDR | 0.000 | 0.000 | 0.013 | 0.599 | 0.000 | 0.156 | 0.231 | 0.000 | ||
| 1 spectrum, MVLGDTFEGEQEVIR | 0.000 | 0.000 | 0.000 | 0.736 | 0.000 | 0.234 | 0.000 | 0.031 | ||
| 1 spectrum, LVVSLGTADALK | 0.000 | 0.000 | 0.264 | 0.000 | 0.565 | 0.032 | 0.139 | 0.000 | ||
| 1 spectrum, LTPVSAQLQDIEGK | 0.000 | 0.000 | 0.096 | 0.186 | 0.293 | 0.343 | 0.083 | 0.000 | ||
| 3 spectra, EVDHVLGK | 0.000 | 0.000 | 0.000 | 0.589 | 0.162 | 0.249 | 0.000 | 0.000 | ||
| 1 spectrum, FADEPVMK | 0.000 | 0.294 | 0.000 | 0.000 | 0.512 | 0.000 | 0.194 | 0.000 | ||
| 2 spectra, EEAWITVSER | 0.000 | 0.000 | 0.000 | 0.783 | 0.080 | 0.135 | 0.000 | 0.002 | ||
| 3 spectra, GFLDGSLDK | 0.000 | 0.000 | 0.000 | 0.736 | 0.157 | 0.100 | 0.000 | 0.007 | ||
| 3 spectra, GPITSEK | 0.150 | 0.000 | 0.084 | 0.358 | 0.271 | 0.095 | 0.041 | 0.000 |
| Plot | Mito | Lyso or Perox | ER | Golgi | PM | Cytosol | Nucleus | ||||||
| Expt B |
5 peptides |
8 spectra |
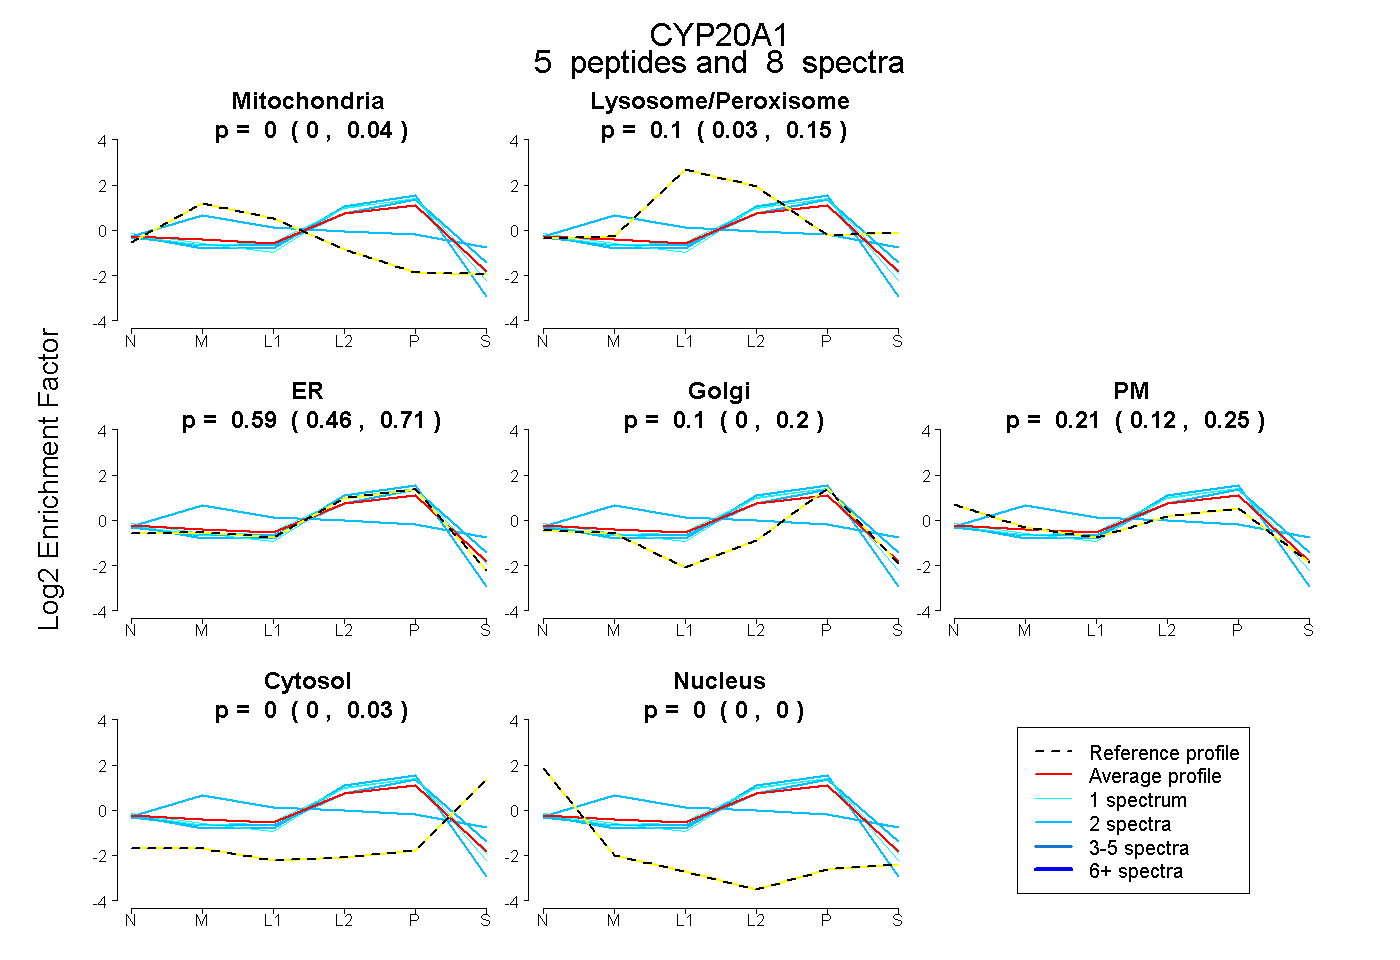 |
0.000 0.000 | 0.037 |
0.105 0.032 | 0.154 |
0.587 0.465 | 0.709 |
0.101 0.000 | 0.200 |
0.207 0.124 | 0.253 |
0.000 0.000 | 0.027 |
0.000 0.000 | 0.003 |
|||
| Plot | Lyso | Other | |||||||||||
| Expt C |
9 peptides |
28 spectra |
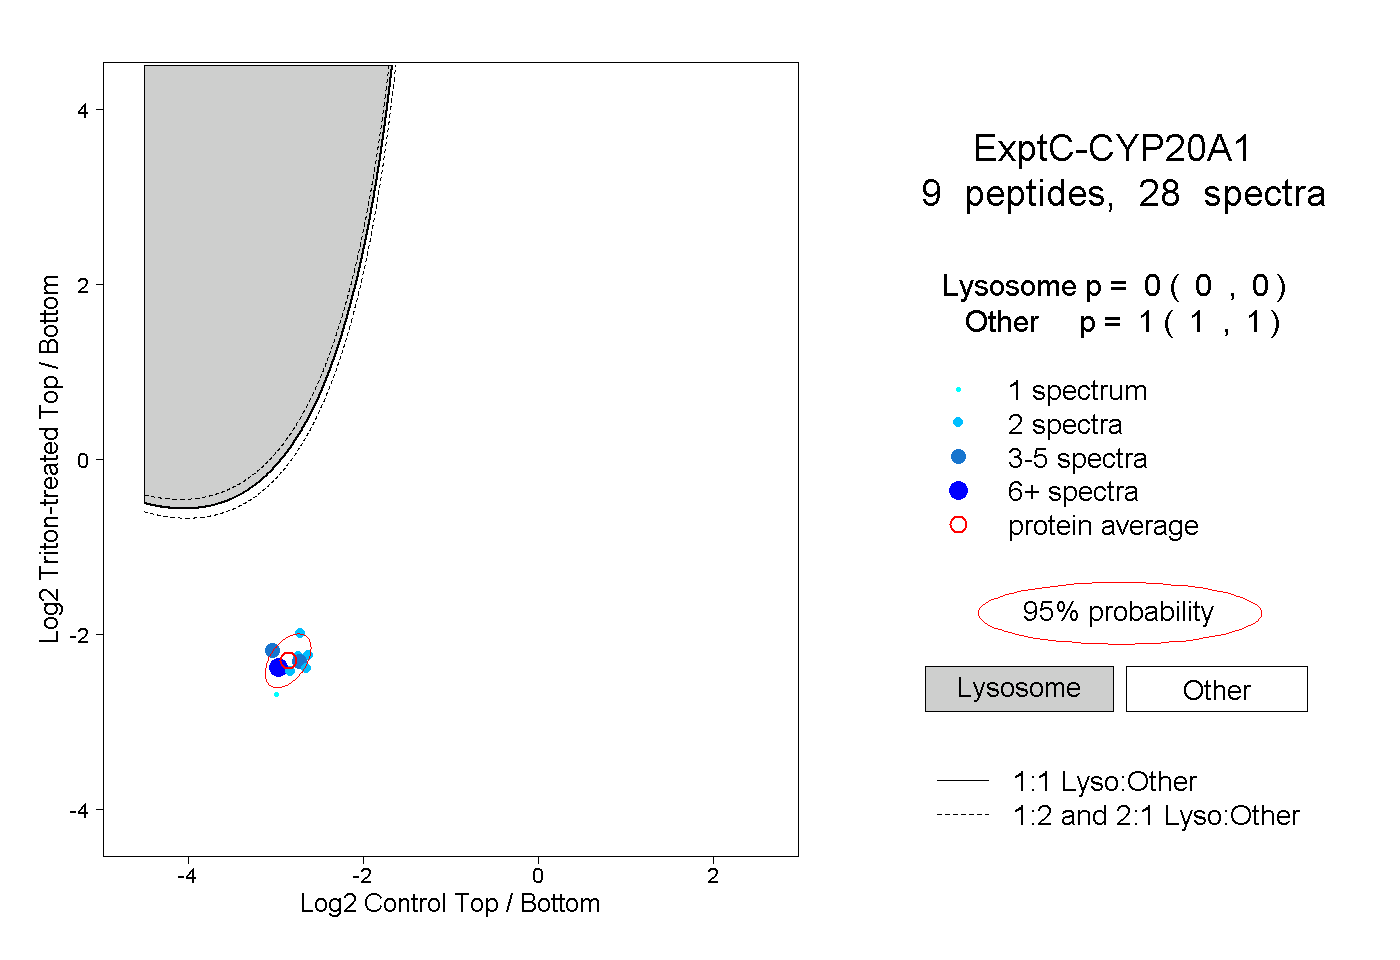 |
0.000 0.000 | 0.000 |
1.000 1.000 | 1.000 |
||||||||
| Plot | Lyso | Other | |||||||||||
| Expt D |
4 peptides |
4 spectra |
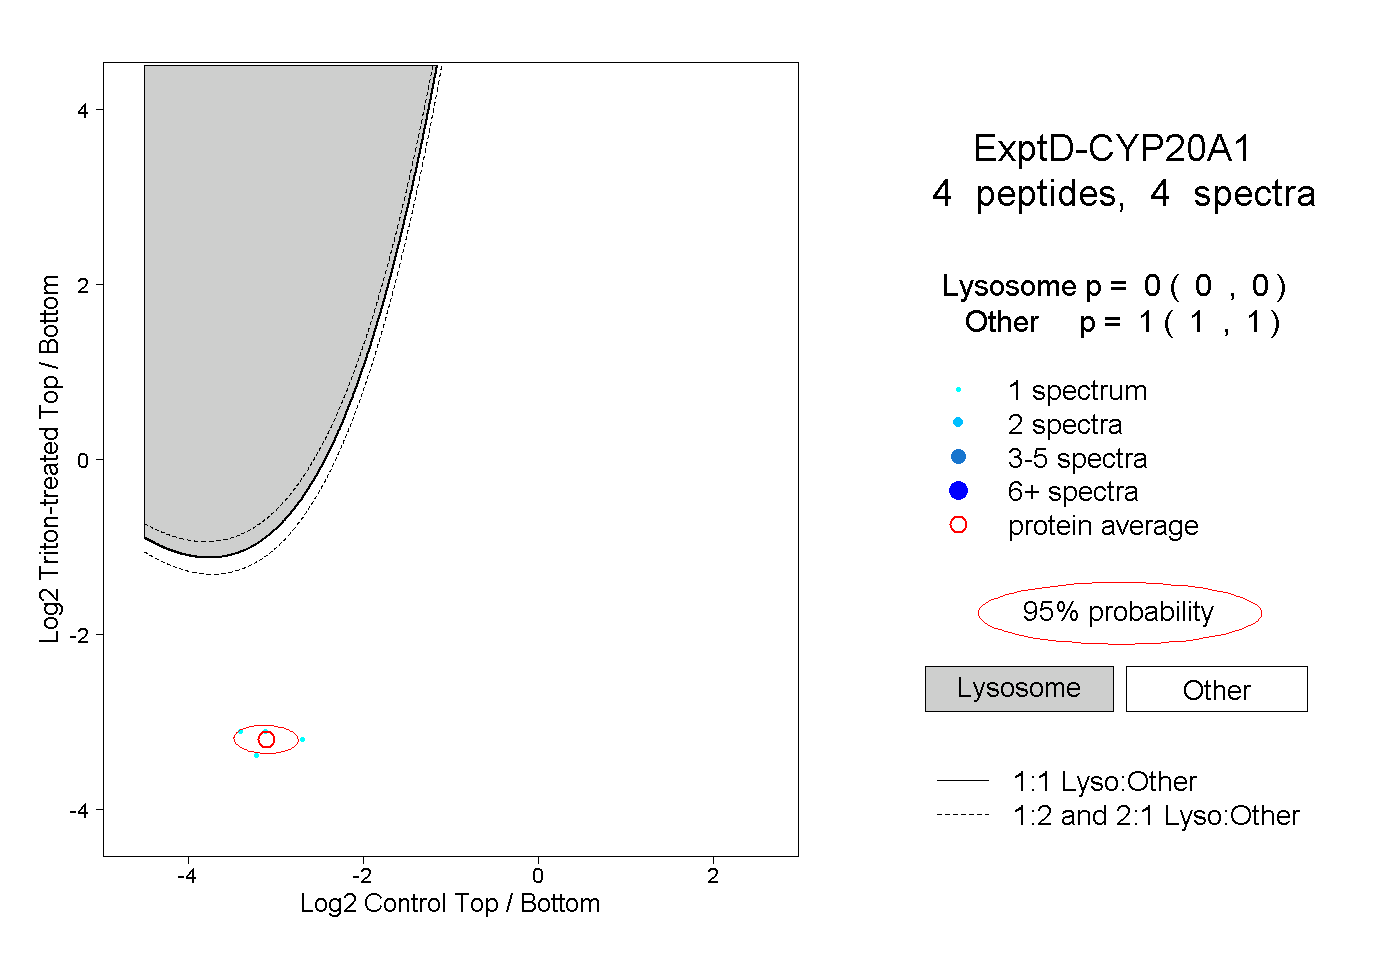 |
0.000 0.000 | 0.000 |
1.000 1.000 | 1.000 |