 5
5peptides
spectra
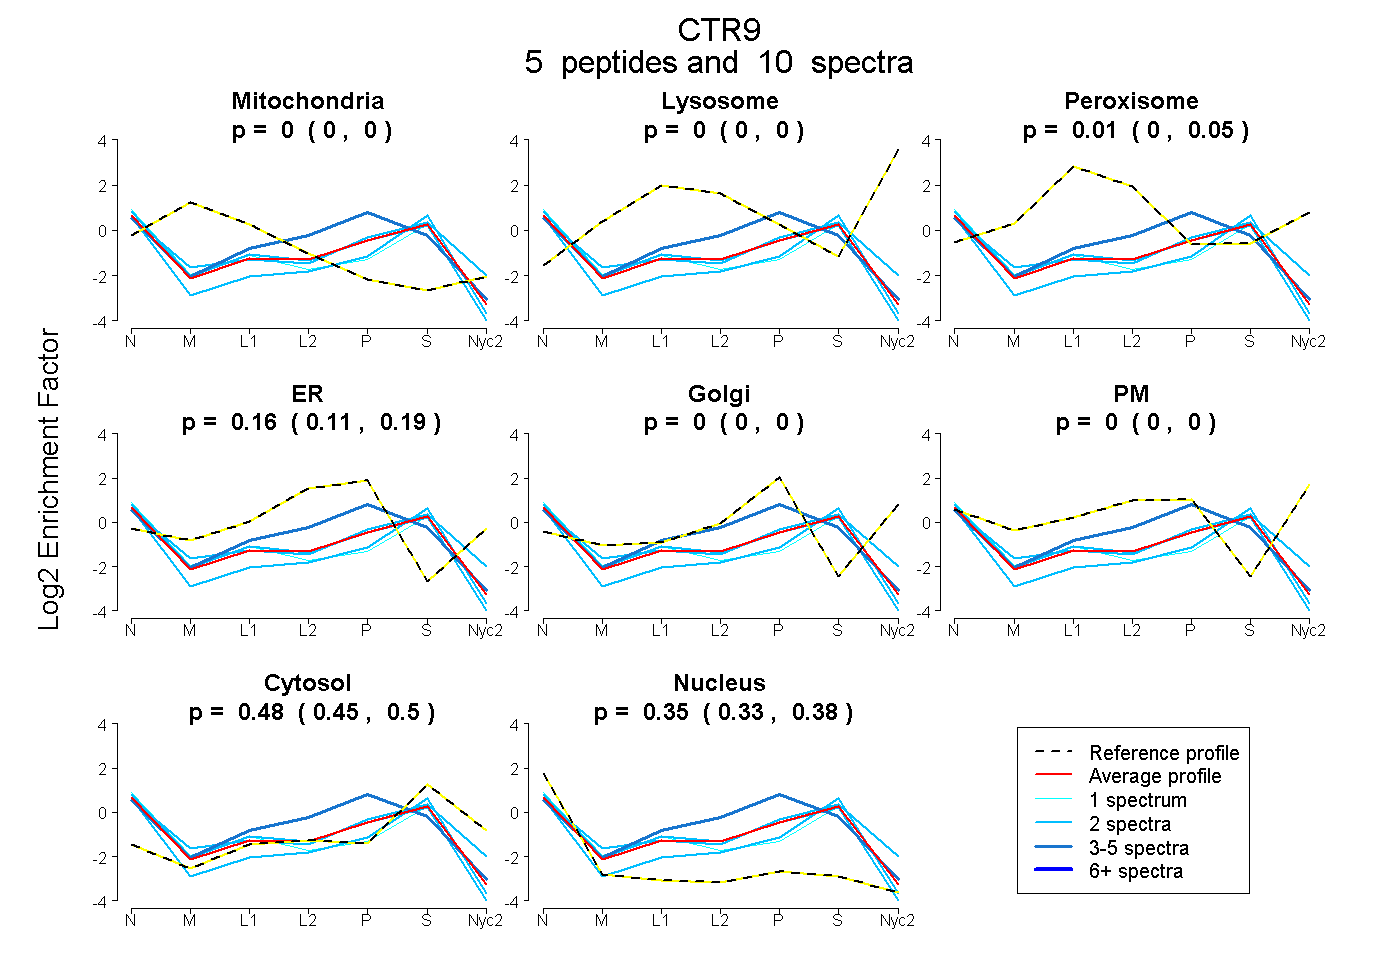
0.000 | 0.000
0.000 | 0.000
0.000 | 0.048
0.107 | 0.188
0.000 | 0.000
0.000 | 0.000
0.453 | 0.495
0.330 | 0.378
2peptides
spectra
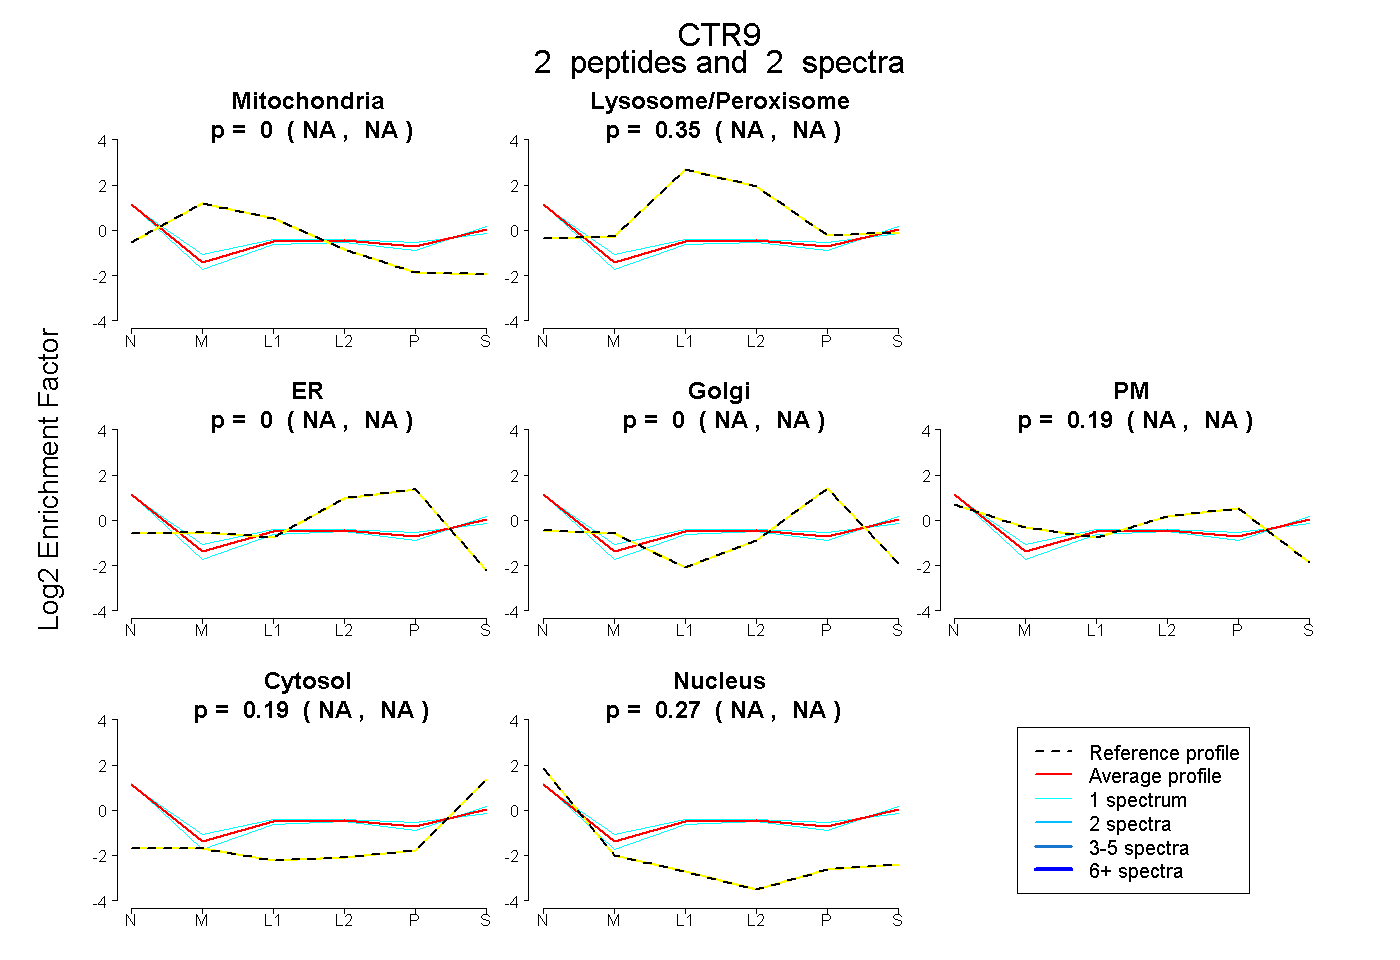
NA | NA
NA | NA
NA | NA
NA | NA
NA | NA
NA | NA
NA | NA
4peptides
spectra
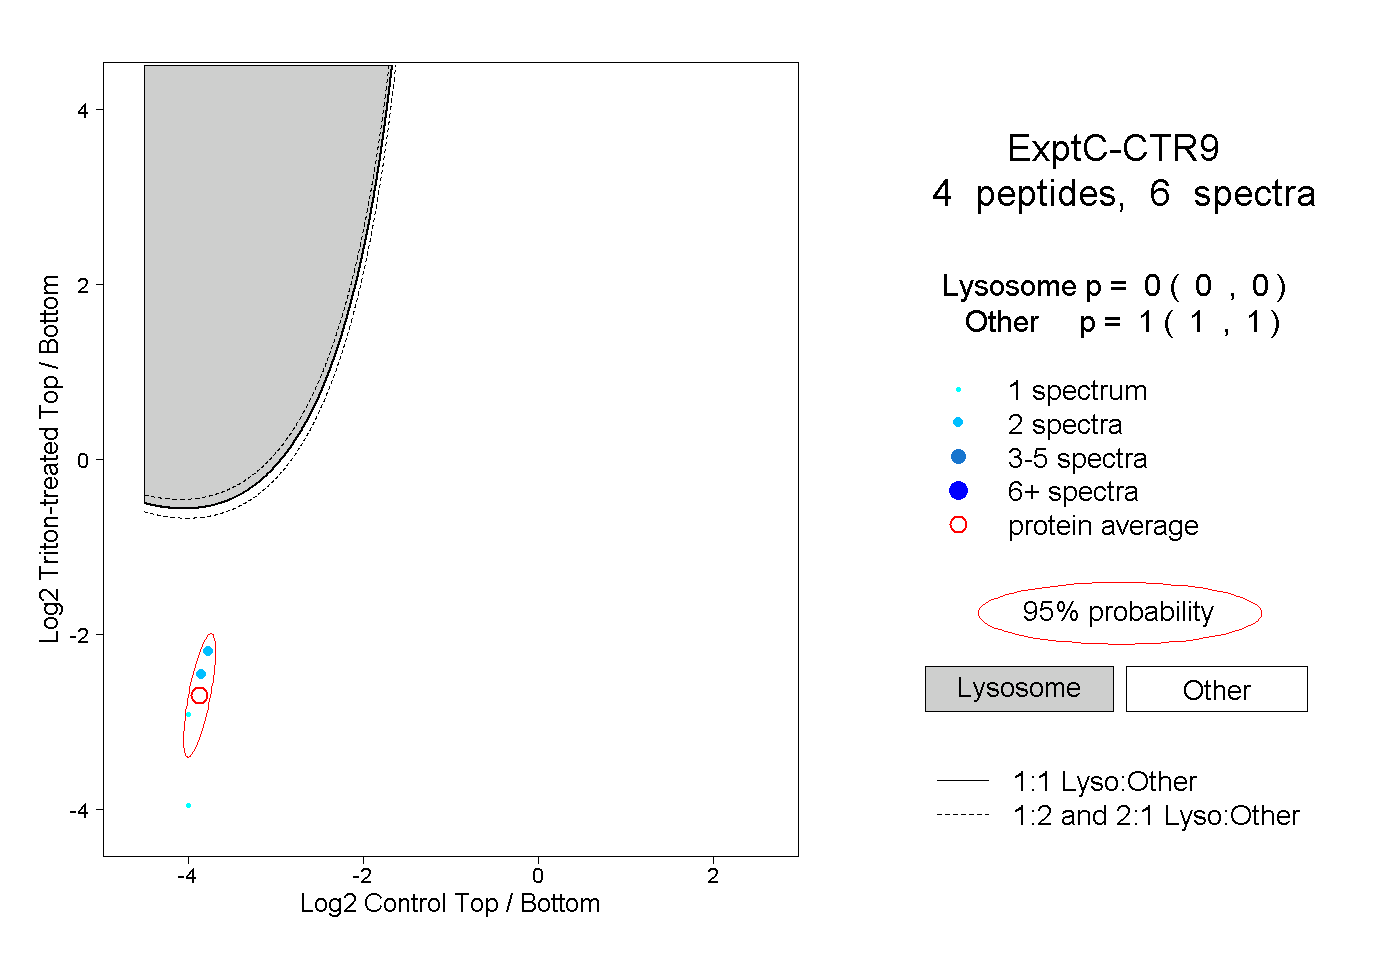
0.000 | 0.000
1.000 | 1.000