 5
5peptides
spectra
0.000 | 0.000
0.000 | 0.000
0.000 | 0.048
0.107 | 0.188
0.000 | 0.000
0.000 | 0.000
0.453 | 0.495
0.330 | 0.378
2peptides
spectra
NA | NA
NA | NA
NA | NA
NA | NA
NA | NA
NA | NA
NA | NA
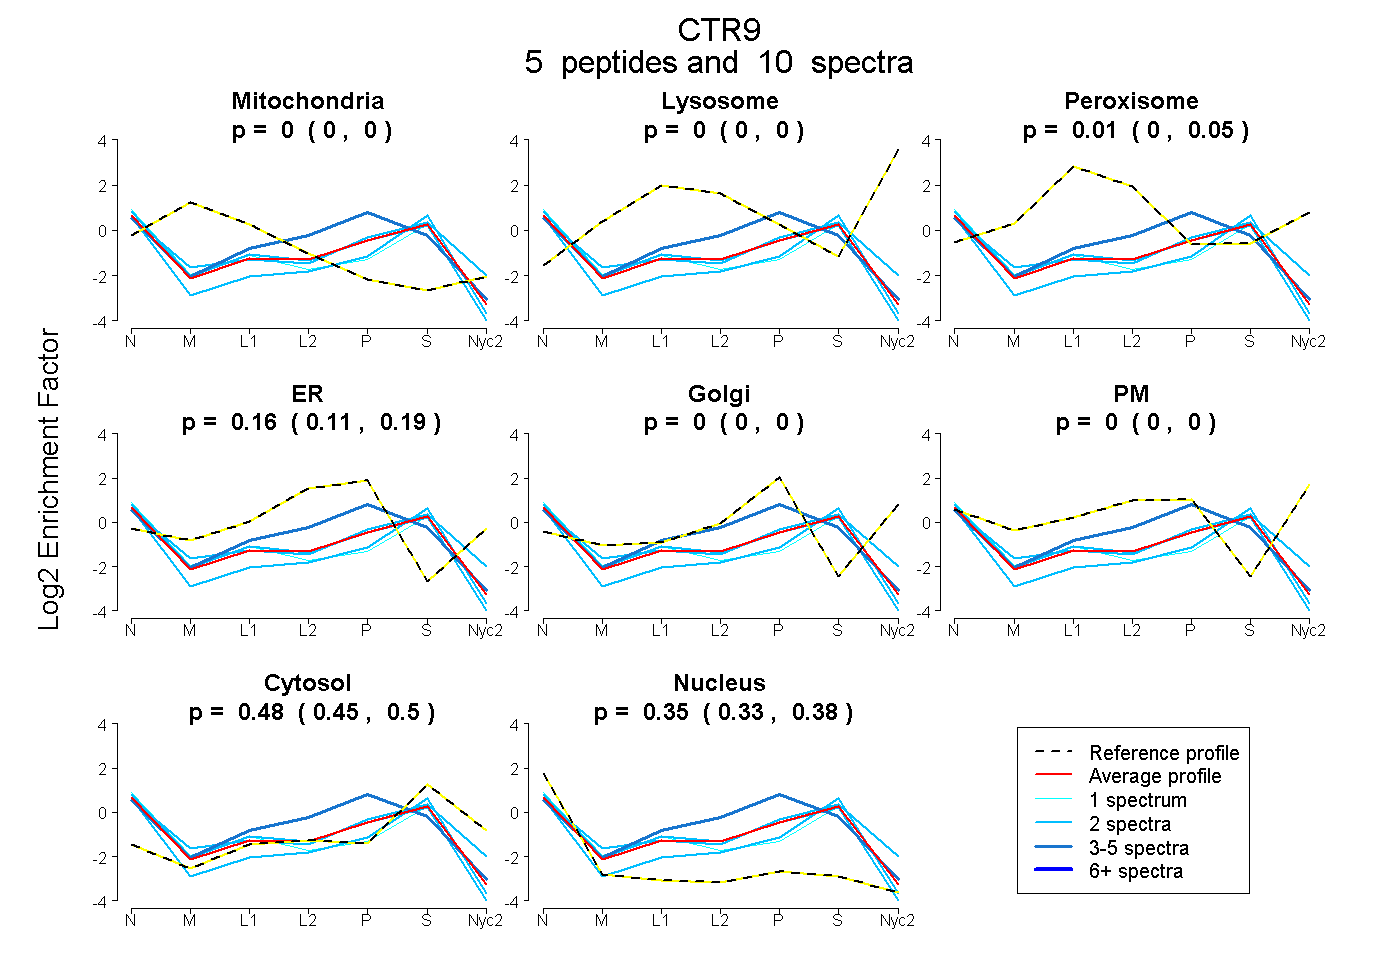
| Plot | Mito | Lyso | Perox | ER | Golgi | PM | Cytosol | Nucleus | |||||
| Expt A |
5 peptides |
10 spectra |
|
0.000 0.000 | 0.000 |
0.000 0.000 | 0.000 |
0.010 0.000 | 0.048 |
0.159 0.107 | 0.188 |
0.000 0.000 | 0.000 |
0.000 0.000 | 0.000 |
0.478 0.453 | 0.495 |
0.353 0.330 | 0.378 |
||
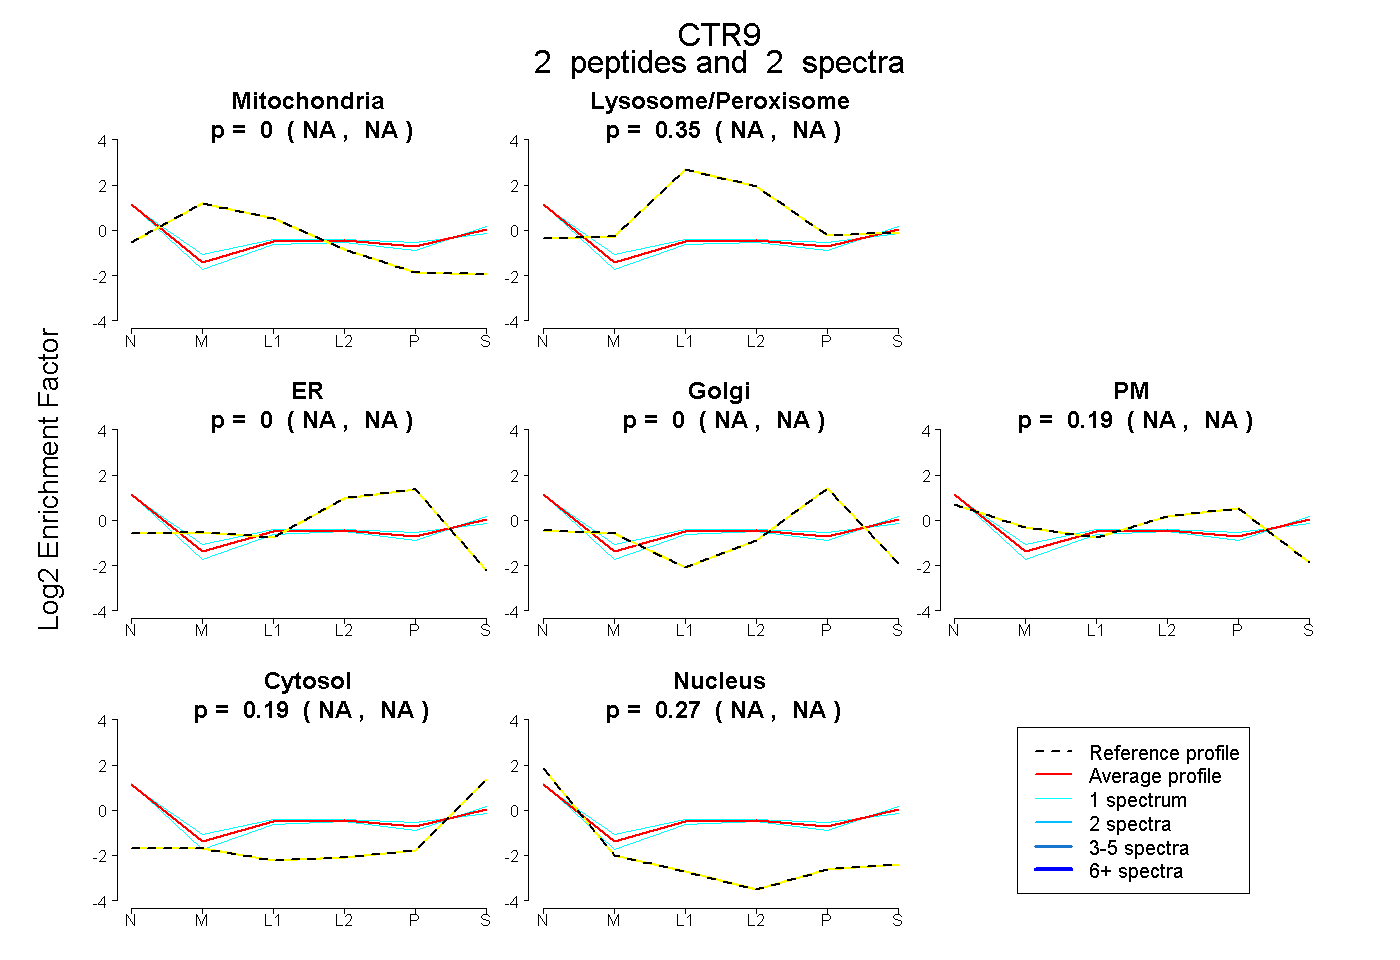
| Plot | Mito | Lyso or Perox | ER | Golgi | PM | Cytosol | Nucleus | ||||||
| Expt B |
2 peptides |
2 spectra |
|
0.000 NA | NA |
0.348 NA | NA |
0.000 NA | NA |
0.000 NA | NA |
0.190 NA | NA |
0.191 NA | NA |
0.272 NA | NA |
| 1 spectrum, ELELAHR | 0.000 | 0.371 | 0.000 | 0.000 | 0.097 | 0.218 | 0.314 | |||
| 1 spectrum, YFLASLDR | 0.000 | 0.325 | 0.000 | 0.000 | 0.283 | 0.163 | 0.229 |
| Plot | Lyso | Other | |||||||||||
| Expt C |
4 peptides |
6 spectra |
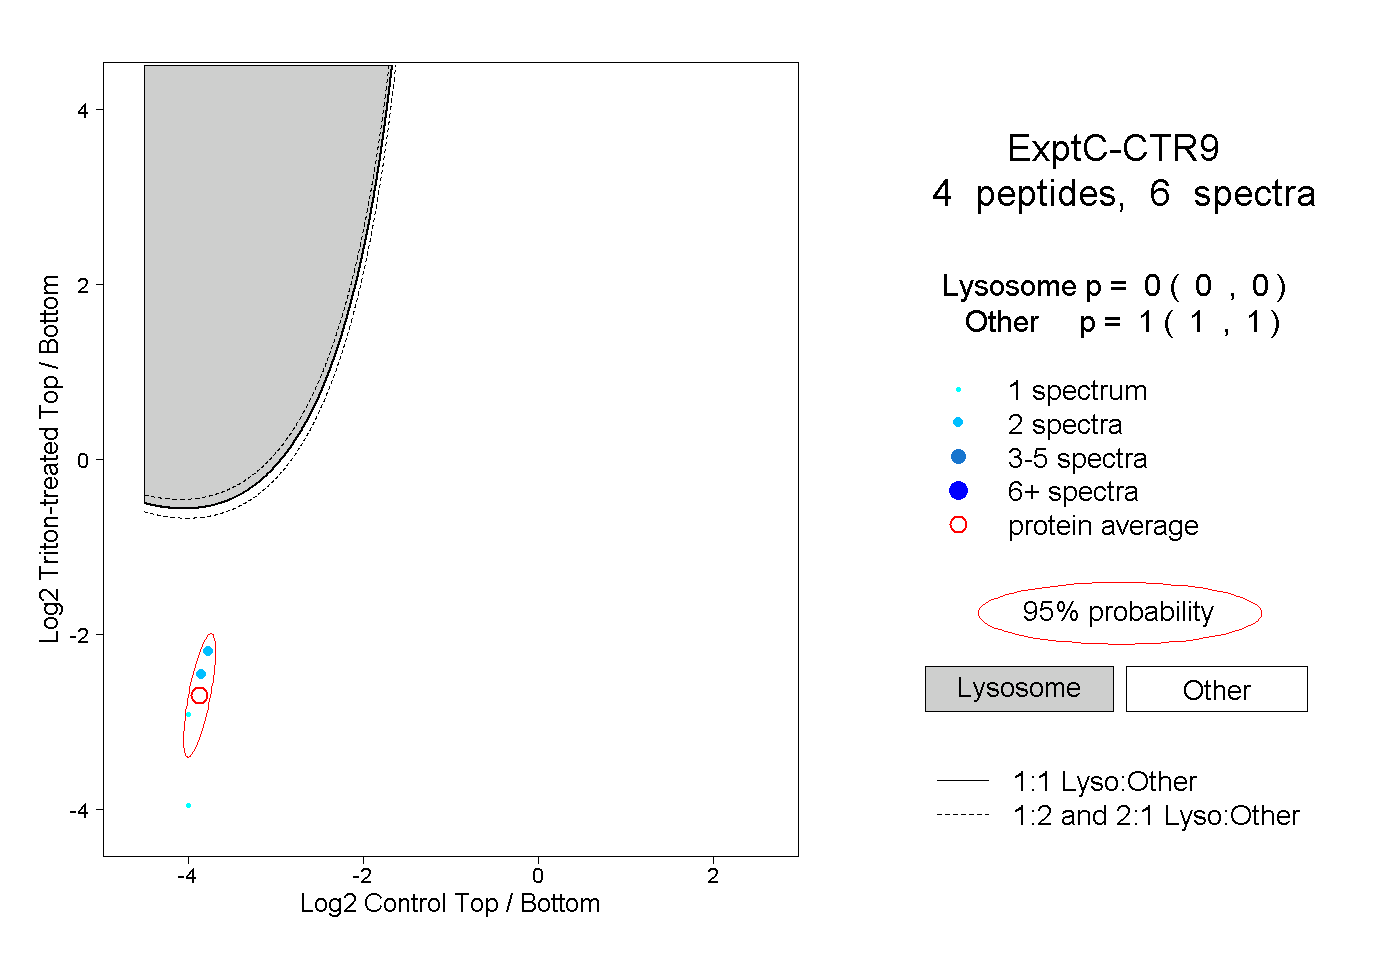 |
0.000 0.000 | 0.000 |
1.000 1.000 | 1.000 |