 6
6peptides
spectra
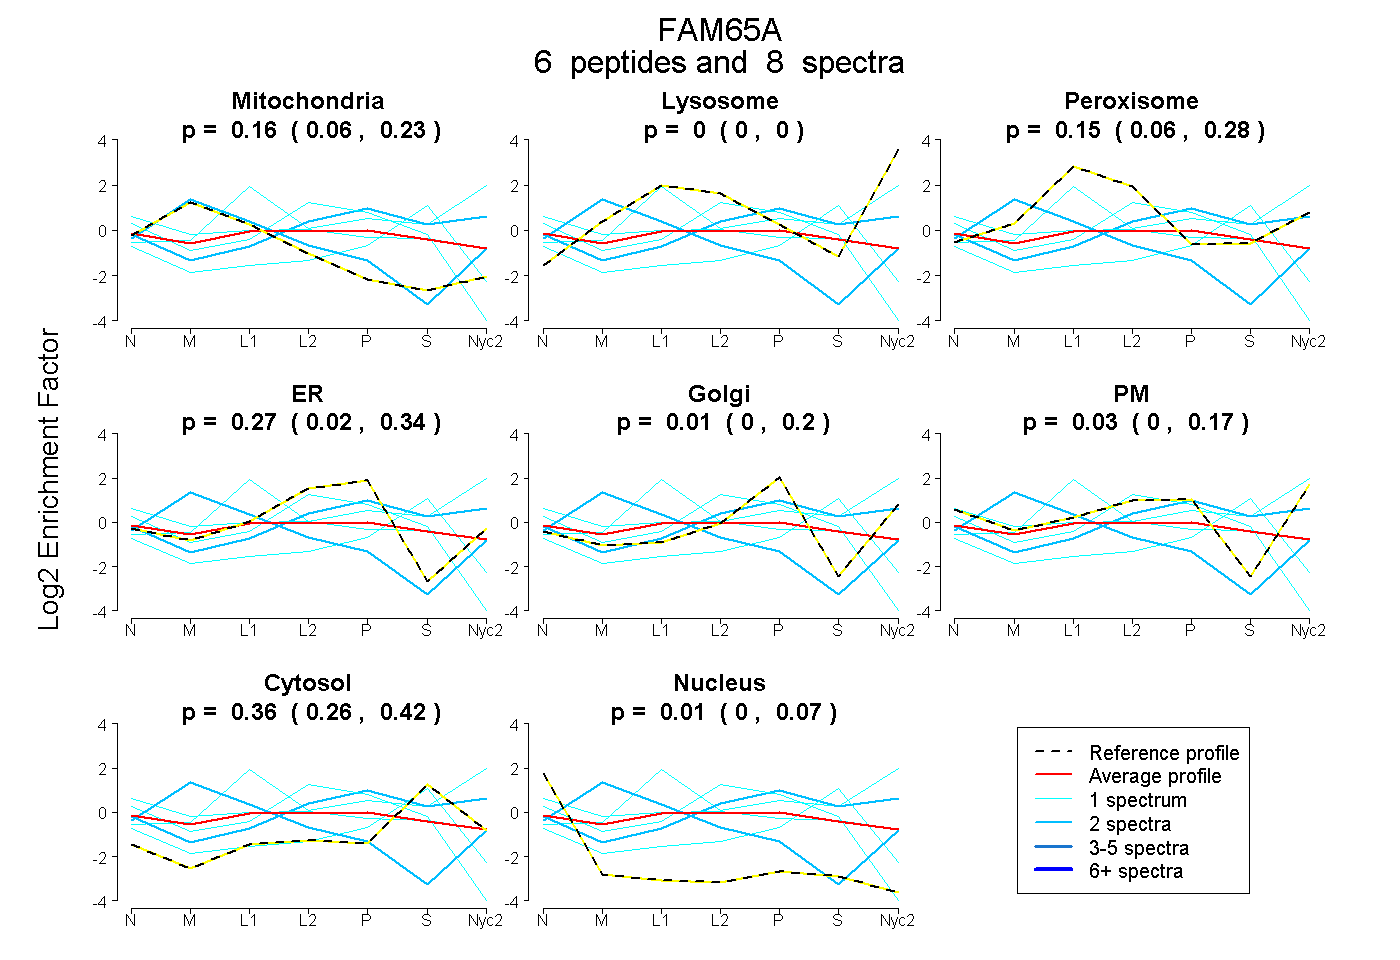
0.058 | 0.231
0.000 | 0.000
0.059 | 0.277
0.016 | 0.344
0.000 | 0.198
0.000 | 0.175
0.257 | 0.418
0.000 | 0.069
5peptides
spectra
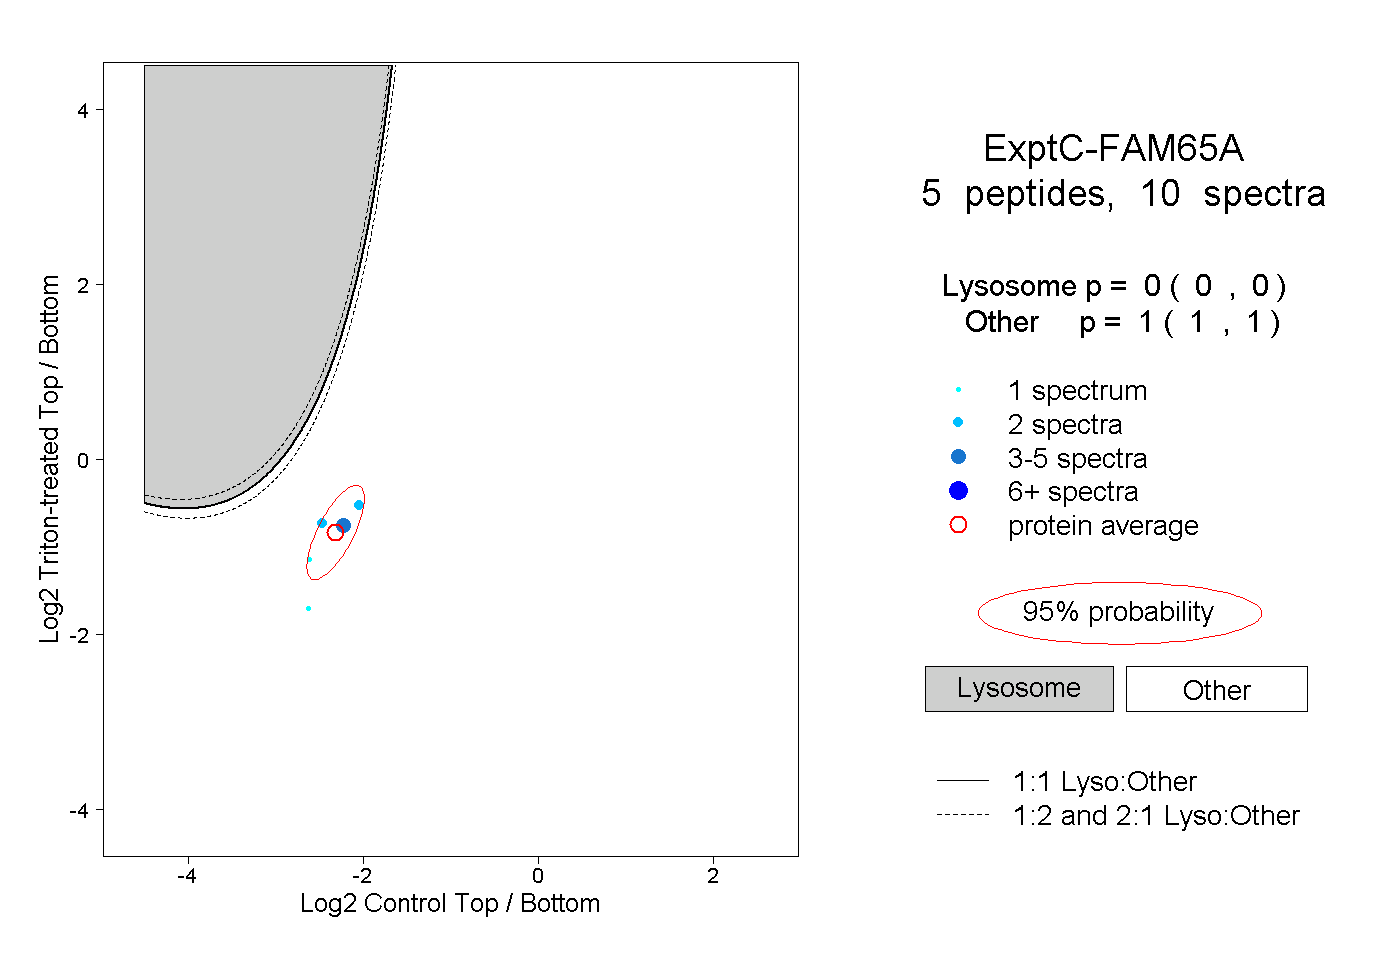
0.000 | 0.000
1.000 | 1.000
3peptides
spectra
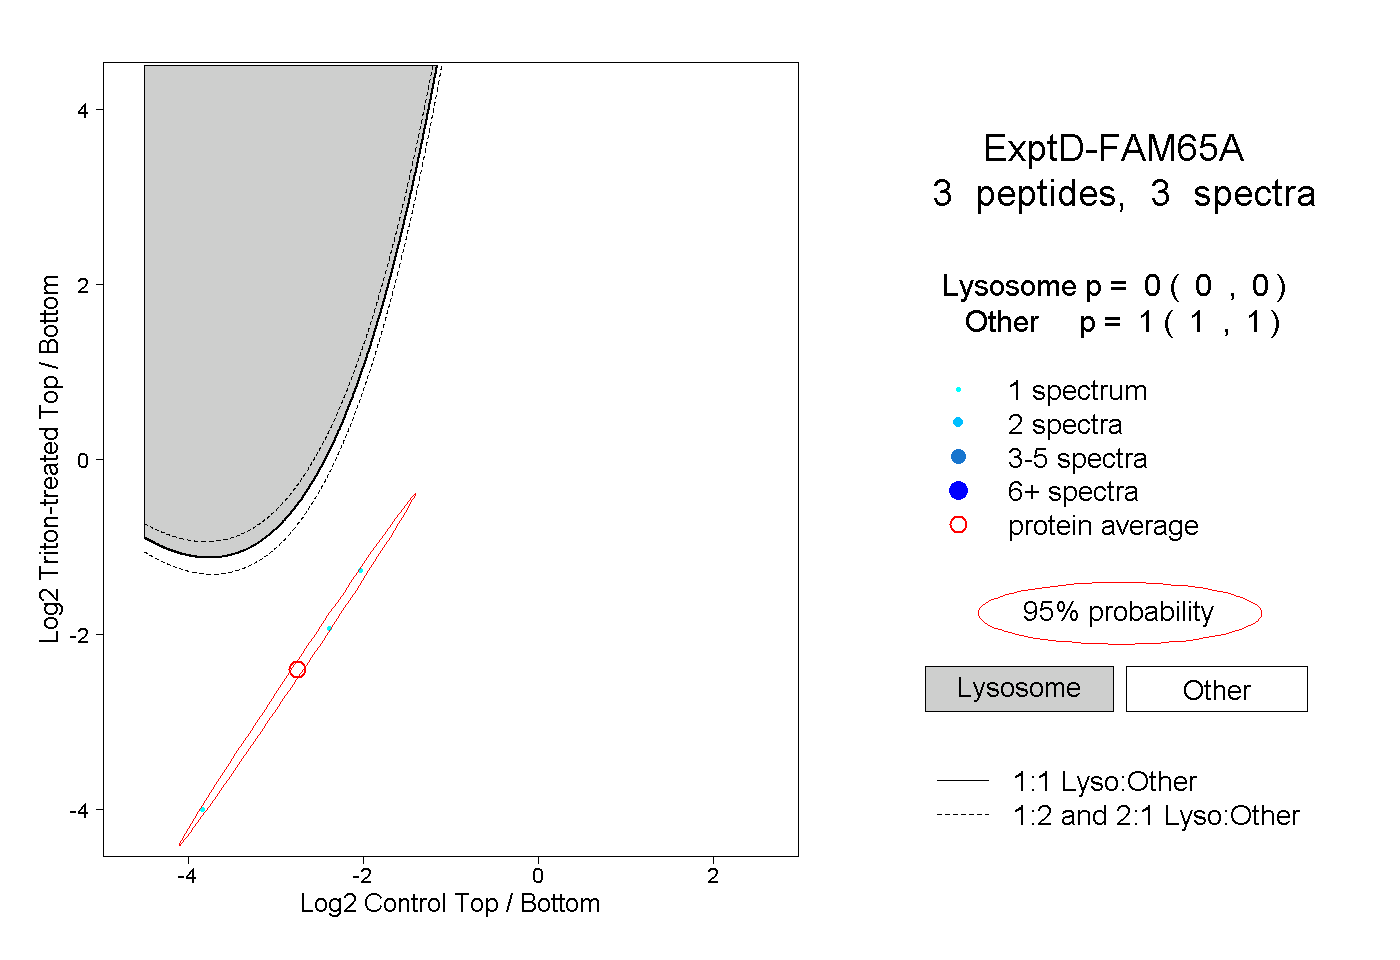
0.000 | 0.000
1.000 | 1.000