 6
6peptides
spectra
0.058 | 0.231
0.000 | 0.000
0.059 | 0.277
0.016 | 0.344
0.000 | 0.198
0.000 | 0.175
0.257 | 0.418
0.000 | 0.069
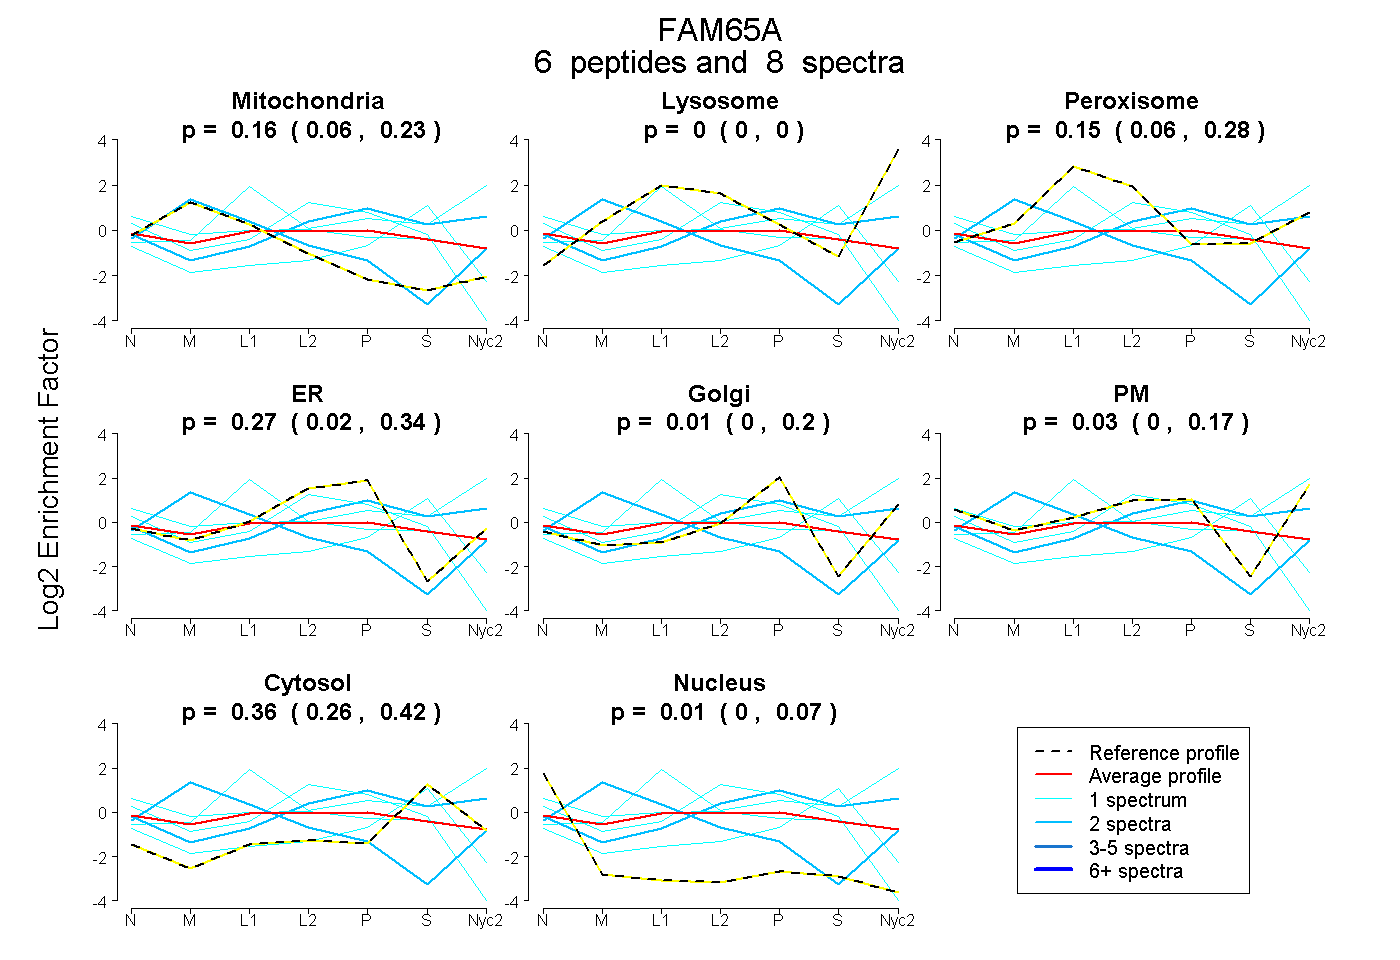
| Plot | Mito | Lyso | Perox | ER | Golgi | PM | Cytosol | Nucleus | |||||
| Expt A |
6 peptides |
8 spectra |
|
0.164 0.058 | 0.231 |
0.000 0.000 | 0.000 |
0.153 0.059 | 0.277 |
0.272 0.016 | 0.344 |
0.009 0.000 | 0.198 |
0.032 0.000 | 0.175 |
0.364 0.257 | 0.418 |
0.006 0.000 | 0.069 |
| 1 spectrum, LDLVYAALK | 0.103 | 0.000 | 0.000 | 0.524 | 0.000 | 0.000 | 0.245 | 0.128 | ||
| 1 spectrum, GQFPELQGLEQEVTR | 0.000 | 0.464 | 0.252 | 0.000 | 0.055 | 0.000 | 0.229 | 0.000 | ||
| 2 spectra, SLSLGPVFR | 0.765 | 0.061 | 0.000 | 0.000 | 0.000 | 0.175 | 0.000 | 0.000 | ||
| 2 spectra, KPLVLSR | 0.000 | 0.078 | 0.000 | 0.105 | 0.130 | 0.261 | 0.426 | 0.000 | ||
| 1 spectrum, LGTFGPLR | 0.041 | 0.000 | 0.000 | 0.055 | 0.000 | 0.000 | 0.788 | 0.116 | ||
| 1 spectrum, LEFHASK | 0.124 | 0.000 | 0.288 | 0.084 | 0.000 | 0.152 | 0.228 | 0.124 |
| Plot | Lyso | Other | |||||||||||
| Expt C |
5 peptides |
10 spectra |
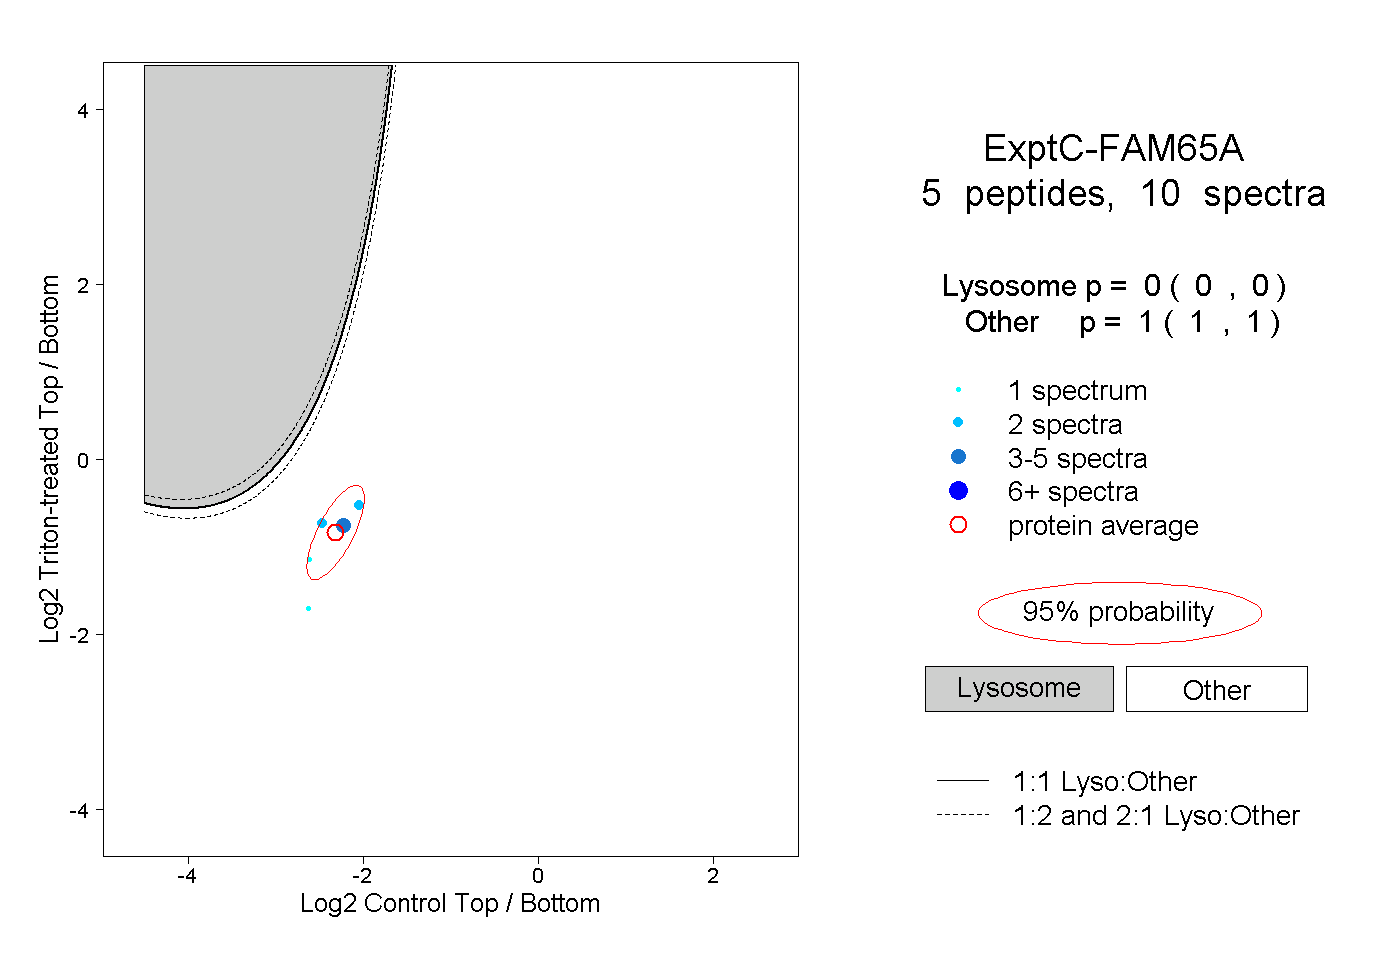 |
0.000 0.000 | 0.000 |
1.000 1.000 | 1.000 |
||||||||
| Plot | Lyso | Other | |||||||||||
| Expt D |
3 peptides |
3 spectra |
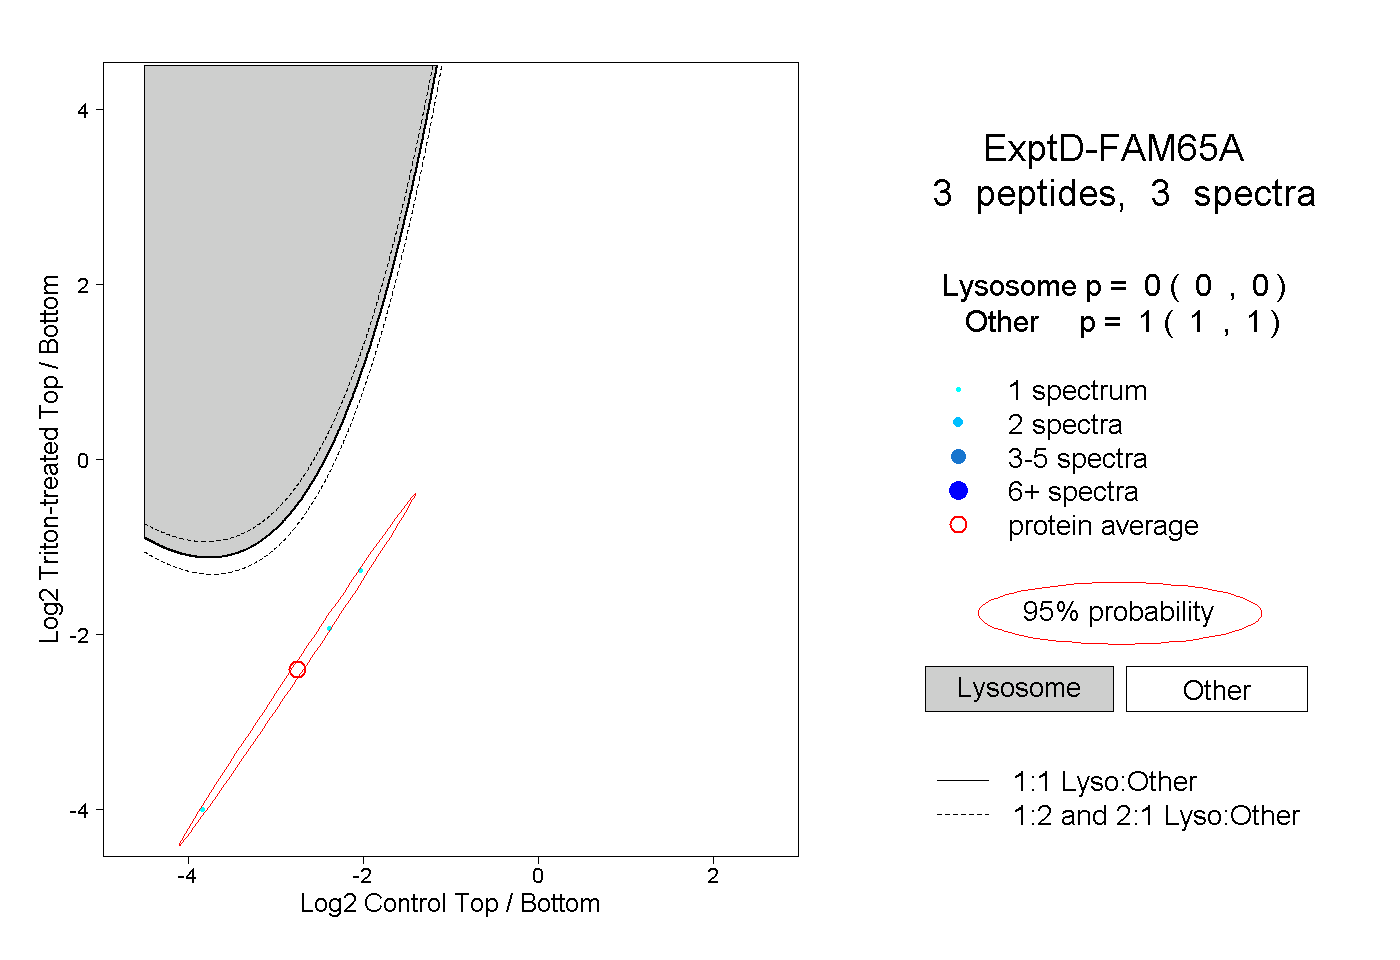 |
0.000 0.000 | 0.000 |
1.000 1.000 | 1.000 |