 7
7peptides
spectra
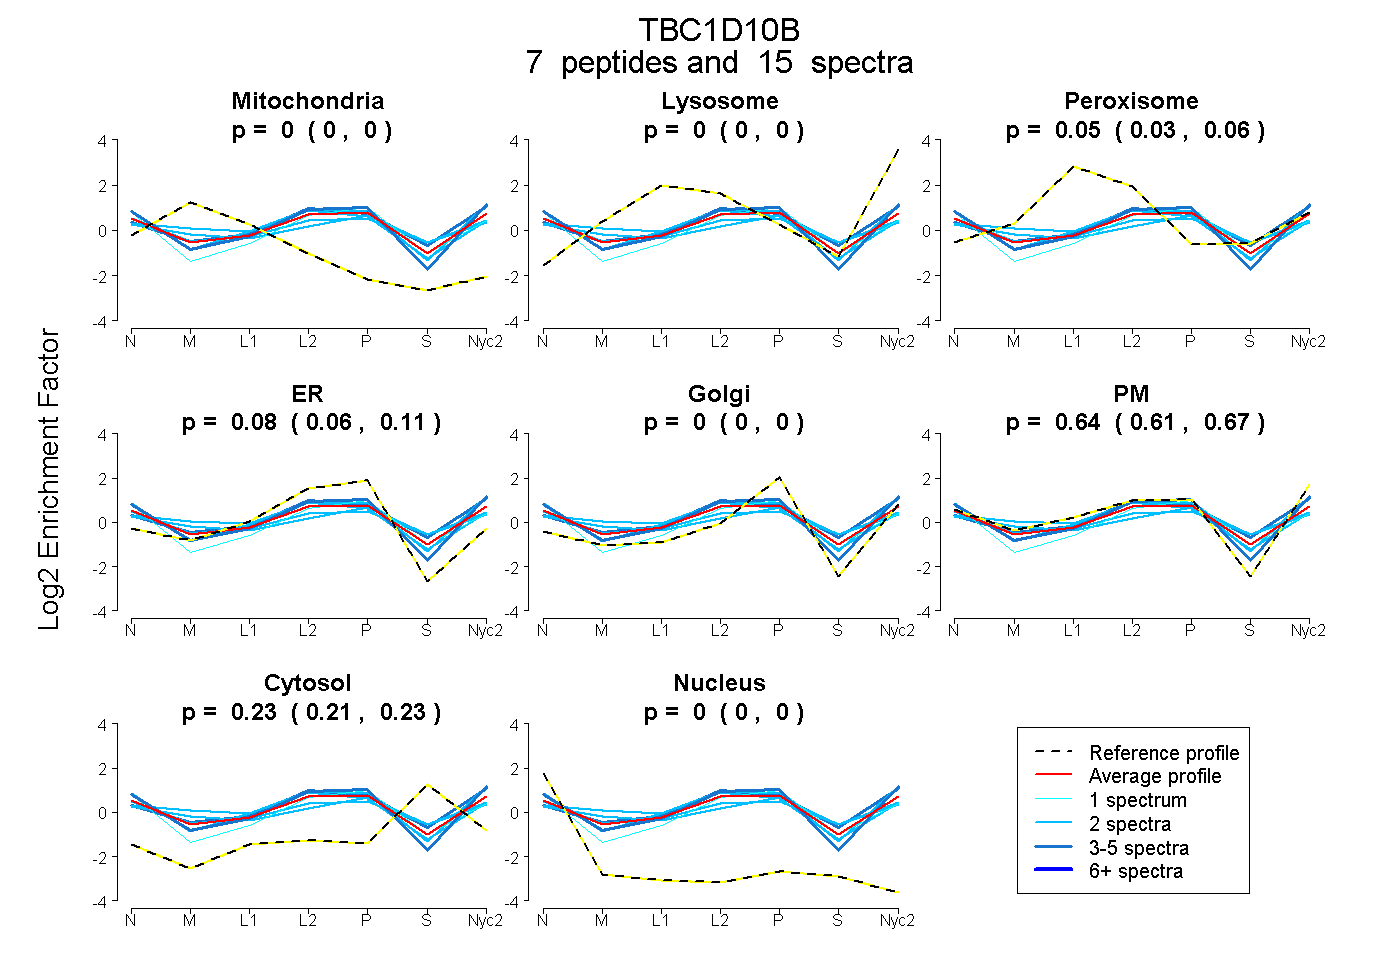
0.000 | 0.000
0.000 | 0.000
0.034 | 0.059
0.055 | 0.106
0.000 | 0.000
0.613 | 0.670
0.214 | 0.234
0.000 | 0.000
1peptide
spectrum
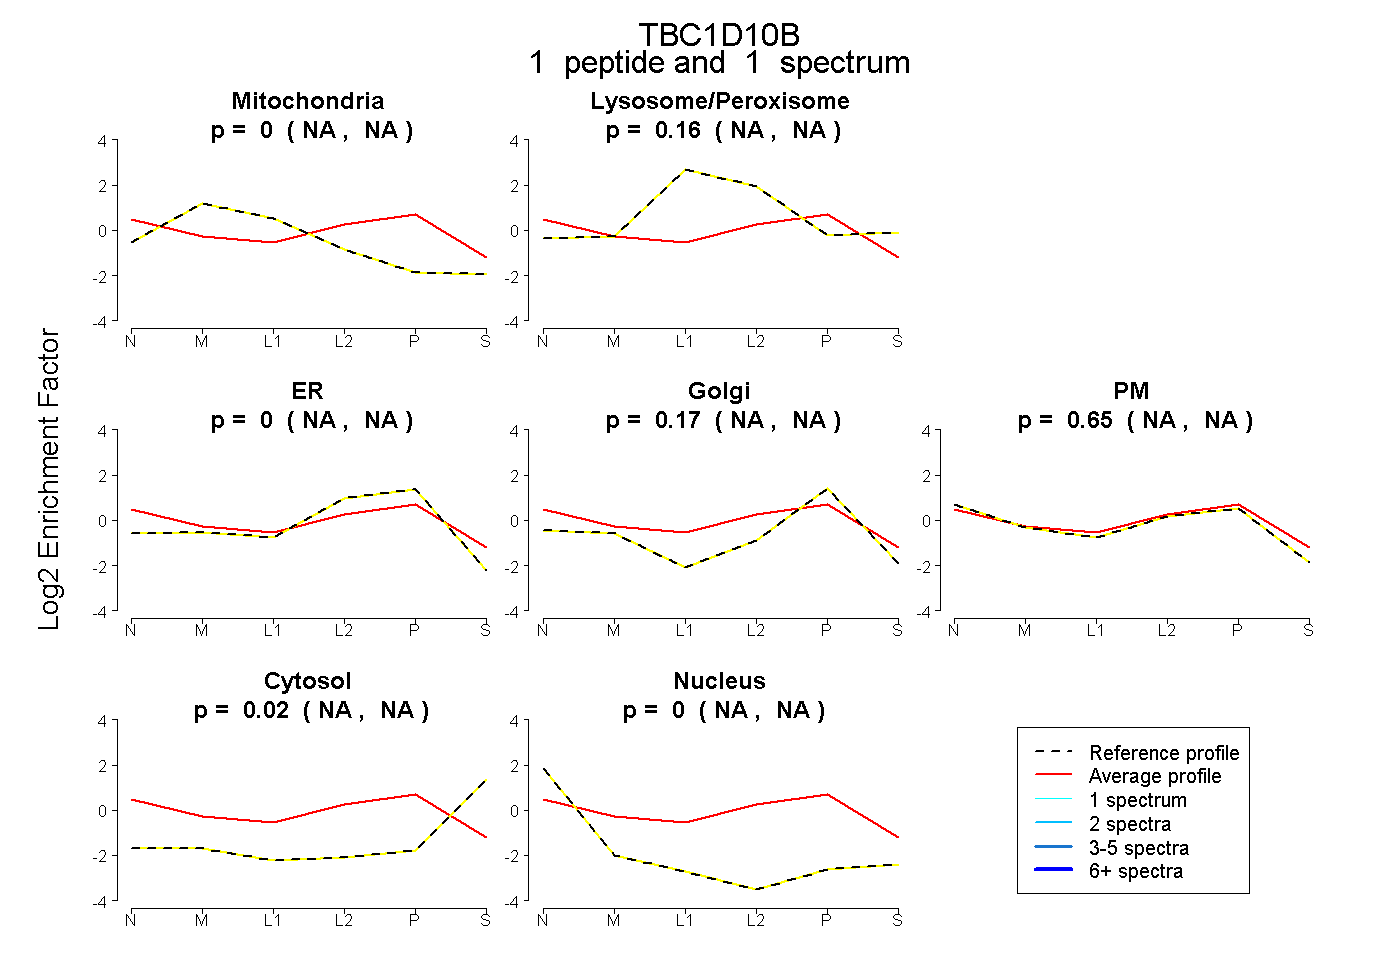
NA | NA
NA | NA
NA | NA
NA | NA
NA | NA
NA | NA
NA | NA
3peptides
spectra
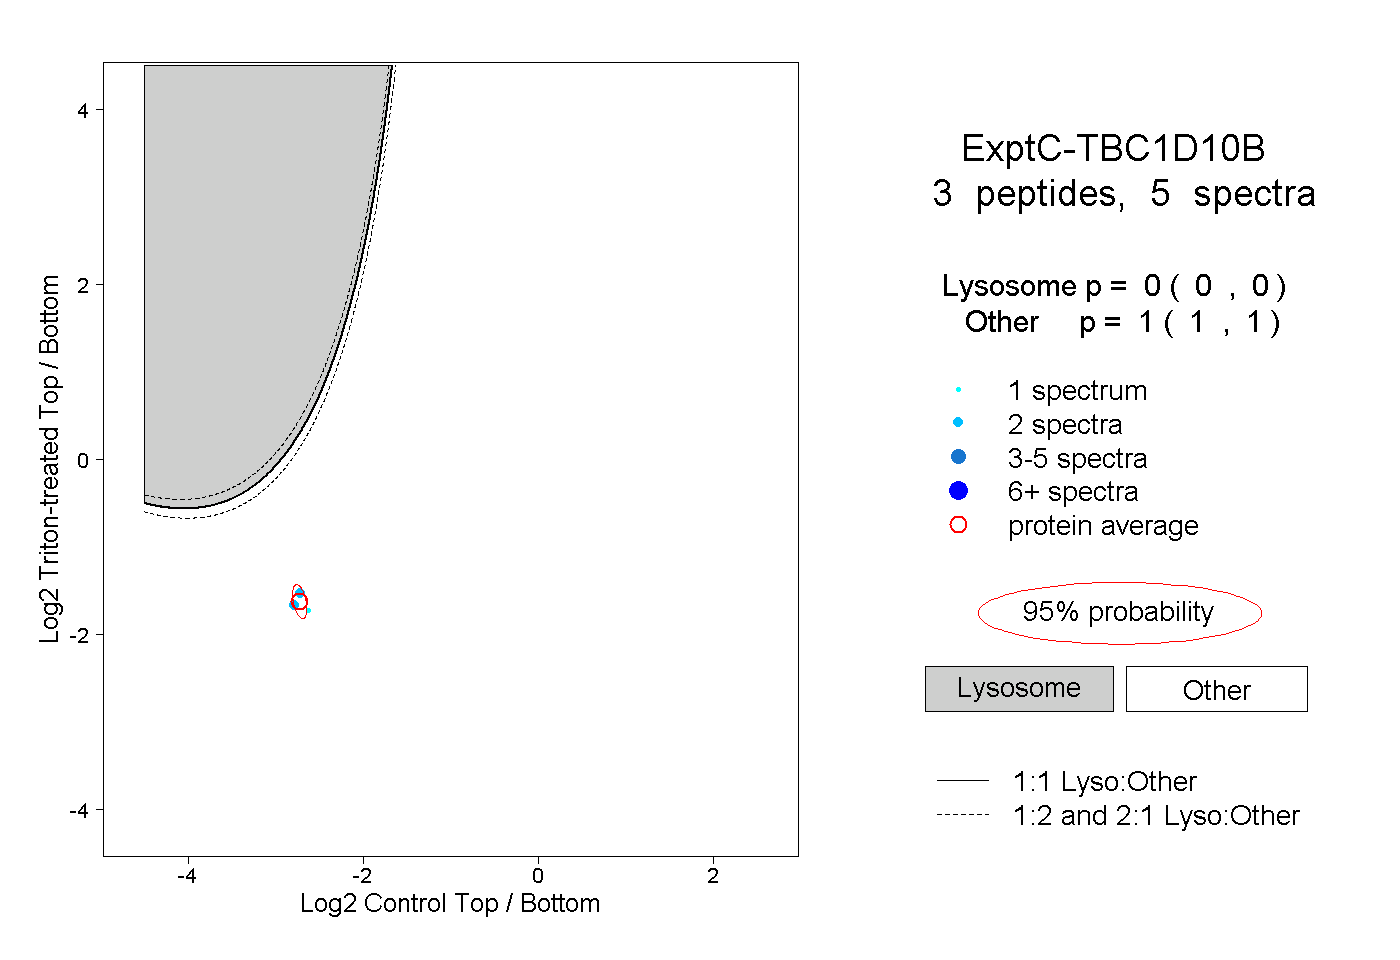
0.000 | 0.000
1.000 | 1.000