 7
7peptides
spectra
0.000 | 0.000
0.000 | 0.000
0.034 | 0.059
0.055 | 0.106
0.000 | 0.000
0.613 | 0.670
0.214 | 0.234
0.000 | 0.000
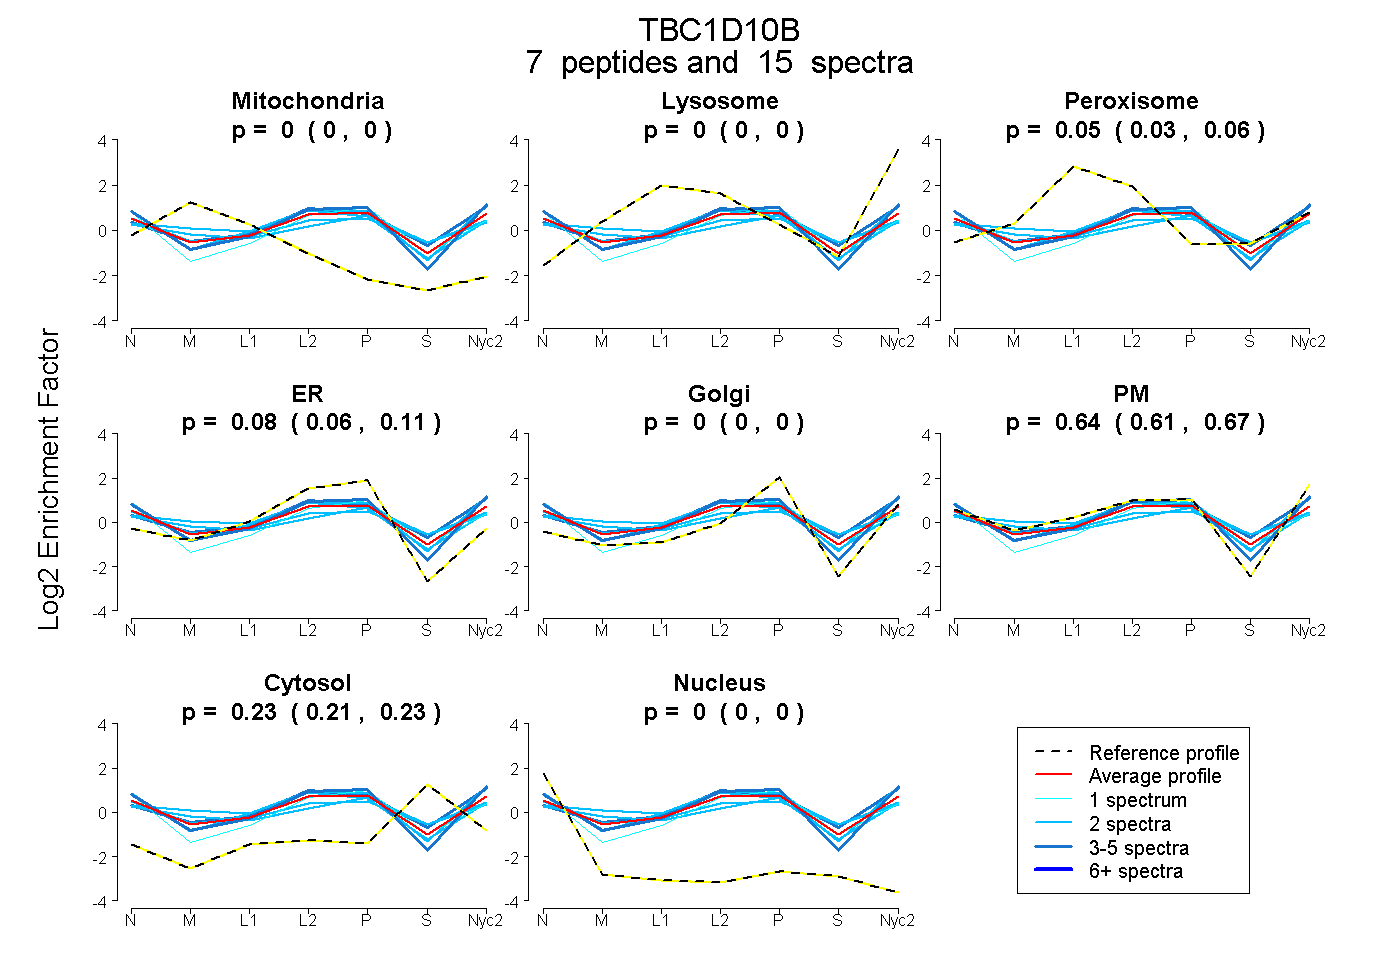
| Plot | Mito | Lyso | Perox | ER | Golgi | PM | Cytosol | Nucleus | |||||
| Expt A |
7 peptides |
15 spectra |
|
0.000 0.000 | 0.000 |
0.000 0.000 | 0.000 |
0.048 0.034 | 0.059 |
0.084 0.055 | 0.106 |
0.000 0.000 | 0.000 |
0.642 0.613 | 0.670 |
0.225 0.214 | 0.234 |
0.000 0.000 | 0.000 |
| 2 spectra, TLPWASVLR | 0.000 | 0.000 | 0.018 | 0.000 | 0.000 | 0.815 | 0.167 | 0.000 | ||
| 3 spectra, AVGGAPSPPPPVR | 0.000 | 0.000 | 0.115 | 0.001 | 0.000 | 0.662 | 0.222 | 0.000 | ||
| 2 spectra, QFPFHEMFAAR | 0.083 | 0.000 | 0.126 | 0.161 | 0.000 | 0.494 | 0.137 | 0.000 | ||
| 1 spectrum, VALVLLR | 0.000 | 0.000 | 0.000 | 0.213 | 0.000 | 0.511 | 0.244 | 0.032 | ||
| 3 spectra, WLDVIEK | 0.000 | 0.000 | 0.000 | 0.069 | 0.000 | 0.805 | 0.110 | 0.016 | ||
| 2 spectra, GGHGQQDLYR | 0.005 | 0.000 | 0.089 | 0.038 | 0.000 | 0.559 | 0.306 | 0.004 | ||
| 2 spectra, GELQYRPSR | 0.056 | 0.000 | 0.102 | 0.000 | 0.148 | 0.425 | 0.268 | 0.000 |
| Plot | Mito | Lyso or Perox | ER | Golgi | PM | Cytosol | Nucleus | ||||||
| Expt B |
1 peptide |
1 spectrum |
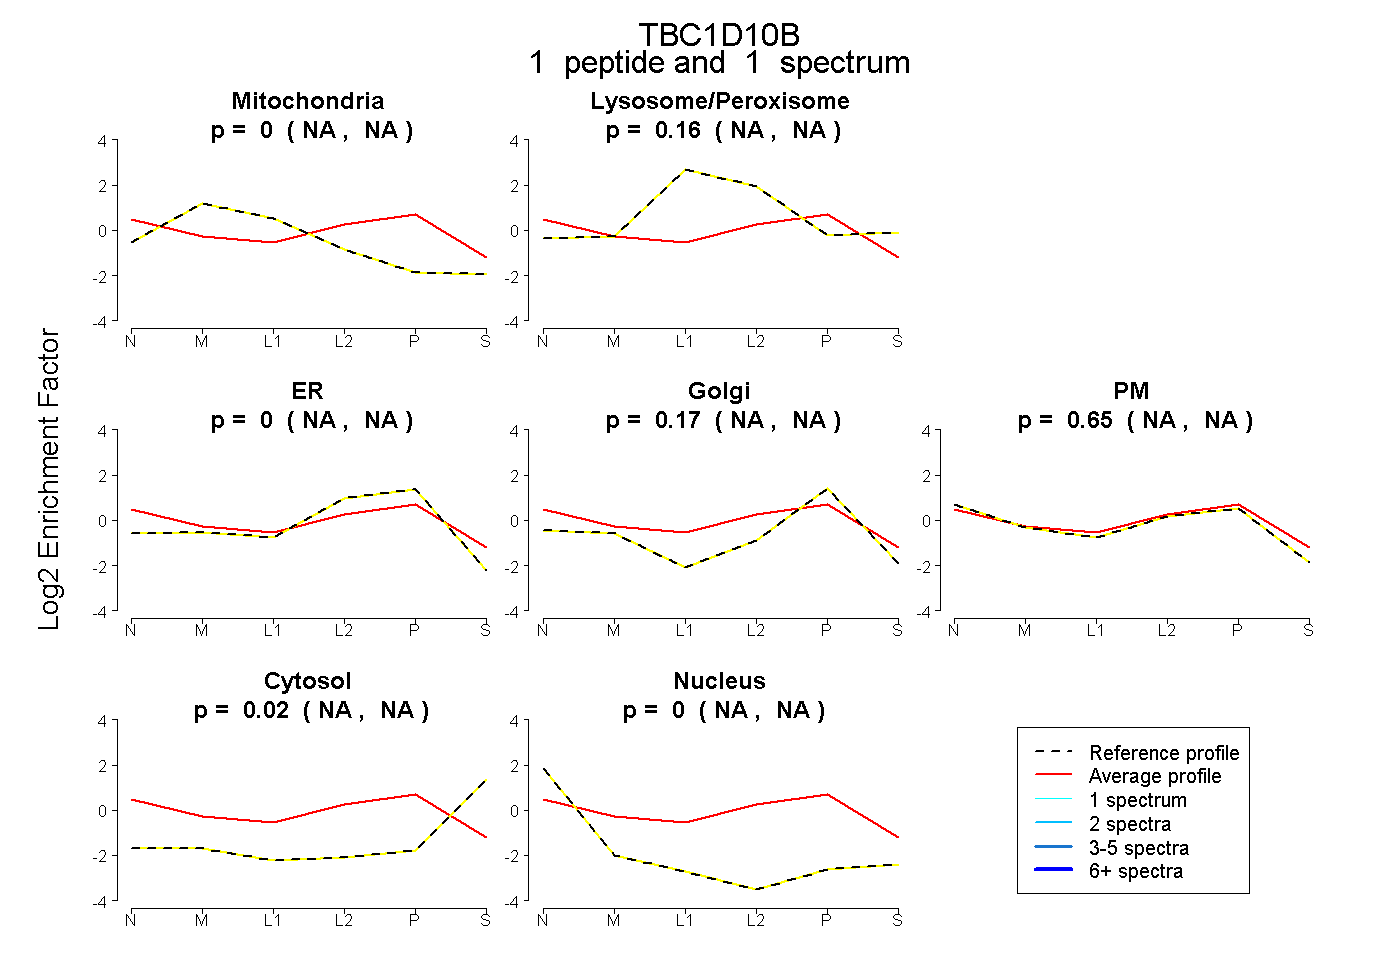 |
0.000 NA | NA |
0.160 NA | NA |
0.000 NA | NA |
0.168 NA | NA |
0.648 NA | NA |
0.023 NA | NA |
0.000 NA | NA |
|||
| Plot | Lyso | Other | |||||||||||
| Expt C |
3 peptides |
5 spectra |
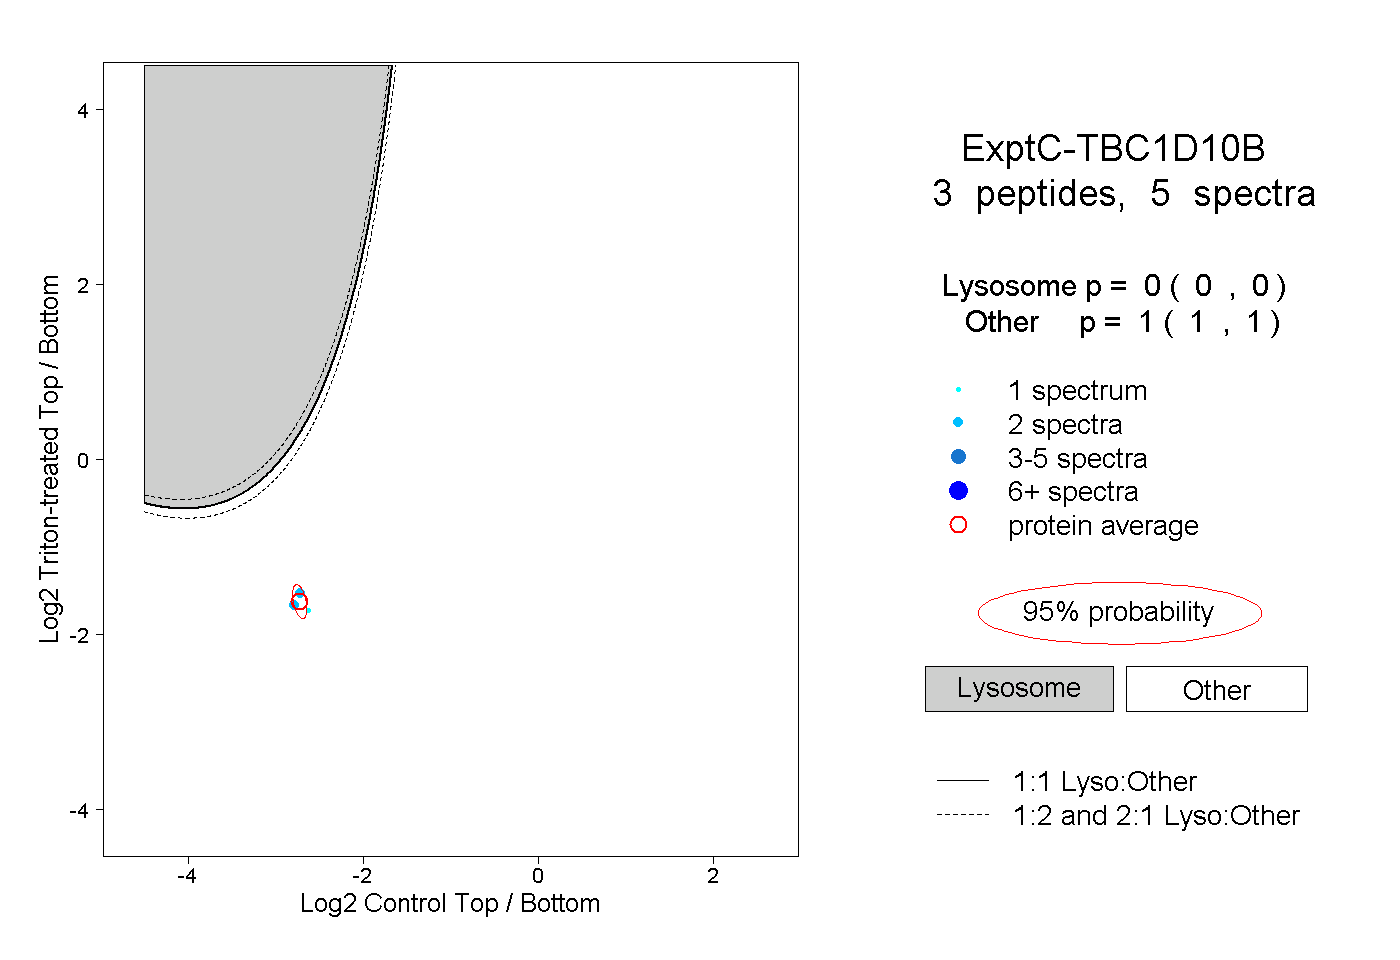 |
0.000 0.000 | 0.000 |
1.000 1.000 | 1.000 |