 7
7peptides
spectra
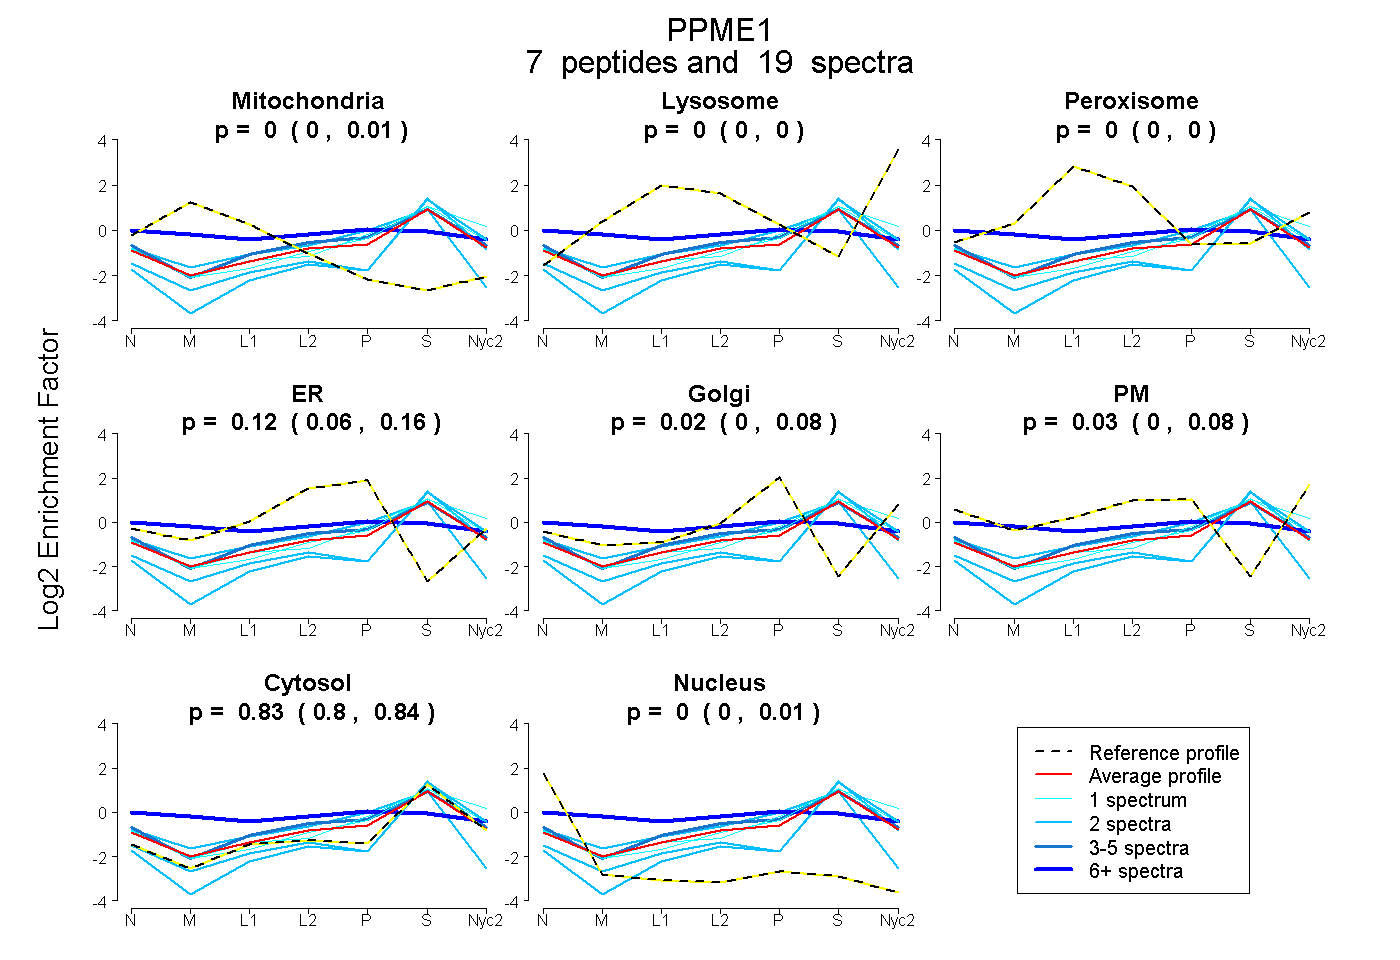
0.000 | 0.008
0.000 | 0.000
0.000 | 0.004
0.058 | 0.158
0.000 | 0.079
0.000 | 0.075
0.805 | 0.844
0.000 | 0.006
1peptide
spectrum
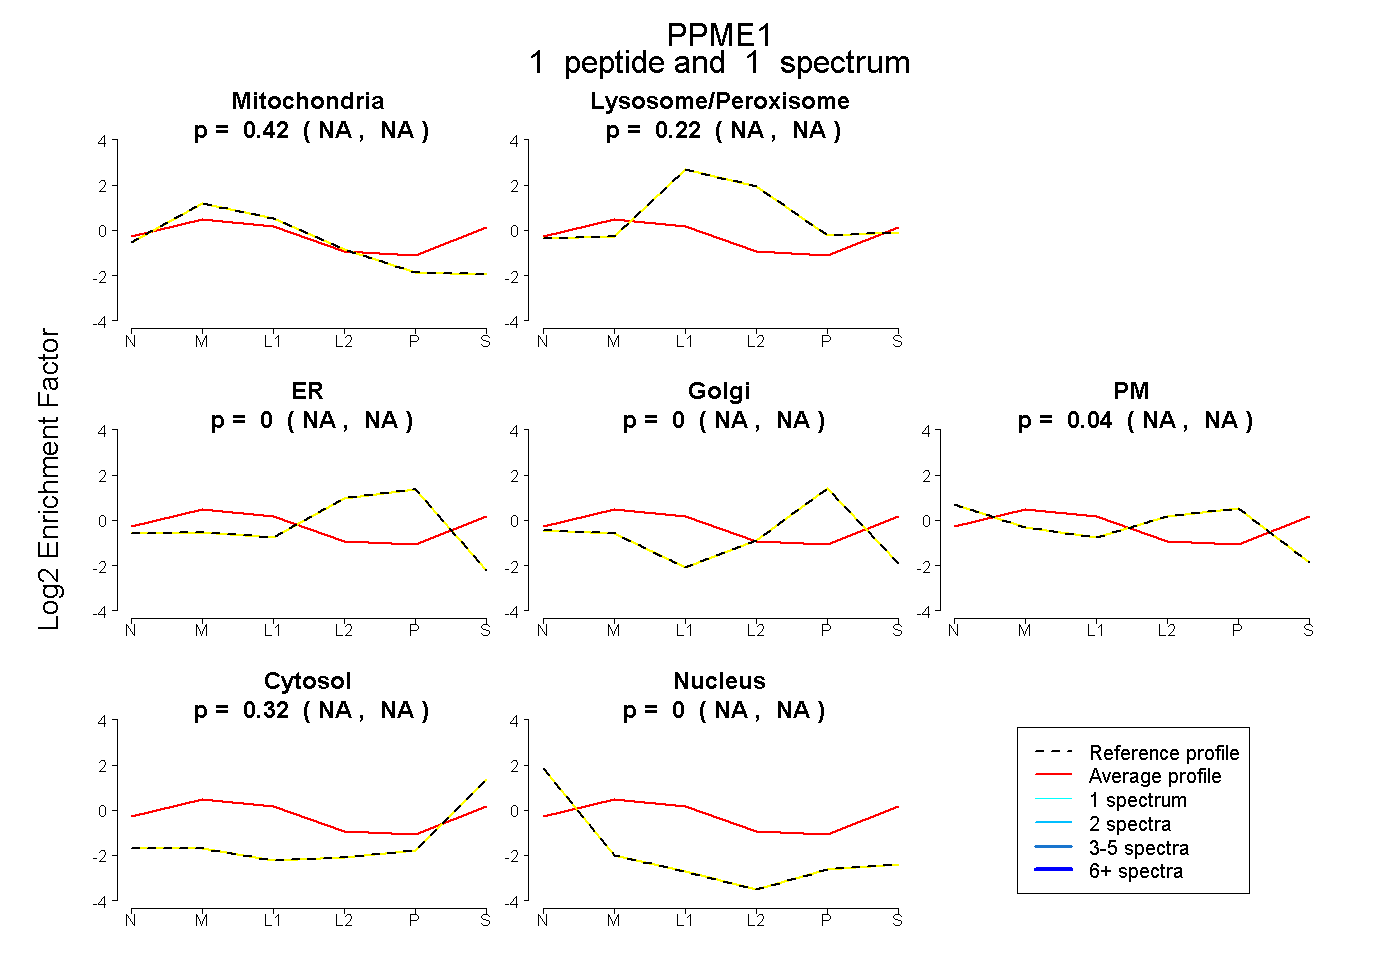
NA | NA
NA | NA
NA | NA
NA | NA
NA | NA
NA | NA
NA | NA
2peptides
spectra
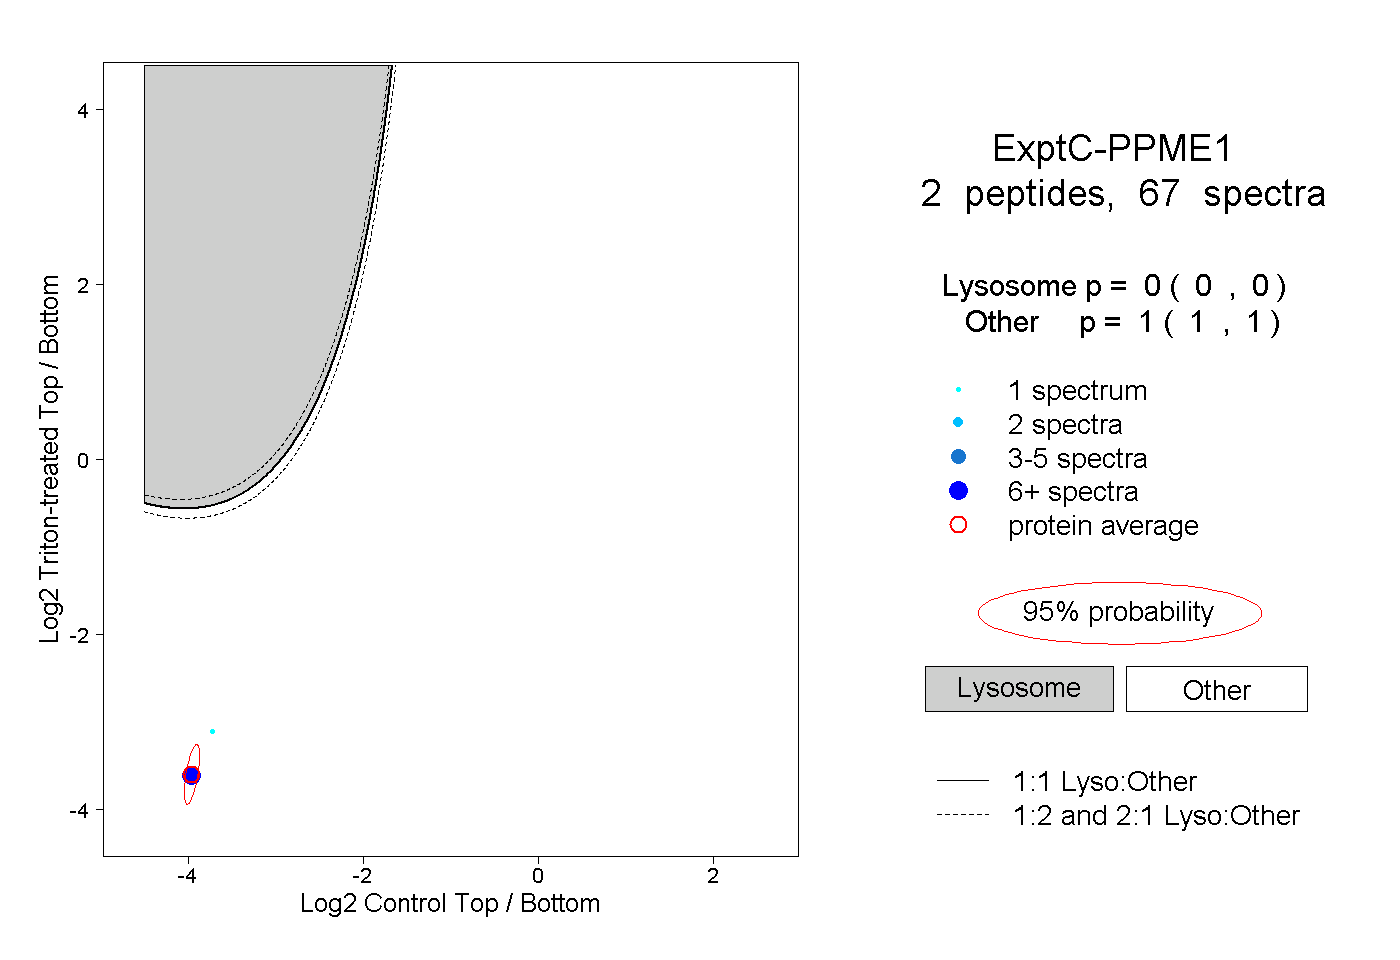
0.000 | 0.000
1.000 | 1.000