 7
7peptides
spectra
0.000 | 0.008
0.000 | 0.000
0.000 | 0.004
0.058 | 0.158
0.000 | 0.079
0.000 | 0.075
0.805 | 0.844
0.000 | 0.006
| Plot | Mito | Lyso | Perox | ER | Golgi | PM | Cytosol | Nucleus | |||||
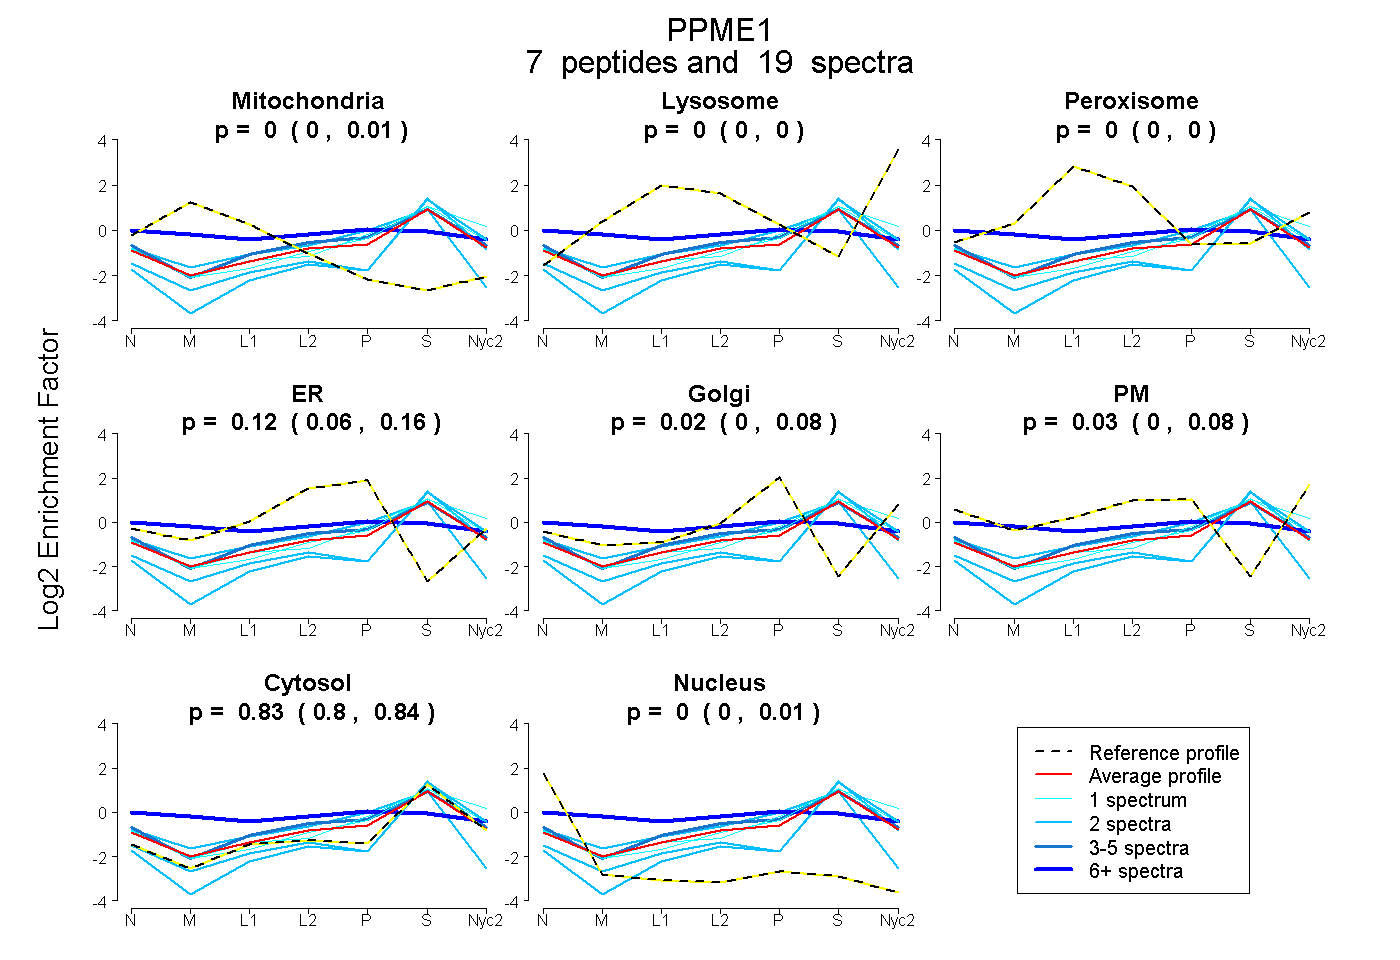
| Expt A |
7 peptides |
19 spectra |
|
0.000 0.000 | 0.008 |
0.000 0.000 | 0.000 |
0.000 0.000 | 0.004 |
0.122 0.058 | 0.158 |
0.025 0.000 | 0.079 |
0.025 0.000 | 0.075 |
0.828 0.805 | 0.844 |
0.000 0.000 | 0.006 |
| 2 spectra, FQMQVLPQCGHAVHEDAPDK | 0.037 | 0.000 | 0.000 | 0.203 | 0.000 | 0.000 | 0.703 | 0.058 | ||
| 2 spectra, LLLLAGVDR | 0.000 | 0.000 | 0.000 | 0.000 | 0.000 | 0.000 | 0.979 | 0.021 | ||
| 3 spectra, GLSNLFLSCPIPK | 0.000 | 0.000 | 0.018 | 0.177 | 0.000 | 0.036 | 0.768 | 0.000 | ||
| 2 spectra, VAEAVATFLIR | 0.000 | 0.000 | 0.000 | 0.000 | 0.000 | 0.000 | 1.000 | 0.000 | ||
| 8 spectra, SALEK | 0.157 | 0.000 | 0.134 | 0.034 | 0.102 | 0.196 | 0.376 | 0.000 | ||
| 1 spectrum, IVALDLR | 0.000 | 0.047 | 0.000 | 0.000 | 0.196 | 0.000 | 0.757 | 0.000 | ||
| 1 spectrum, SLENAIEWSVK | 0.000 | 0.000 | 0.000 | 0.000 | 0.194 | 0.000 | 0.806 | 0.000 |
| Plot | Mito | Lyso or Perox | ER | Golgi | PM | Cytosol | Nucleus | ||||||
| Expt B |
1 peptide |
1 spectrum |
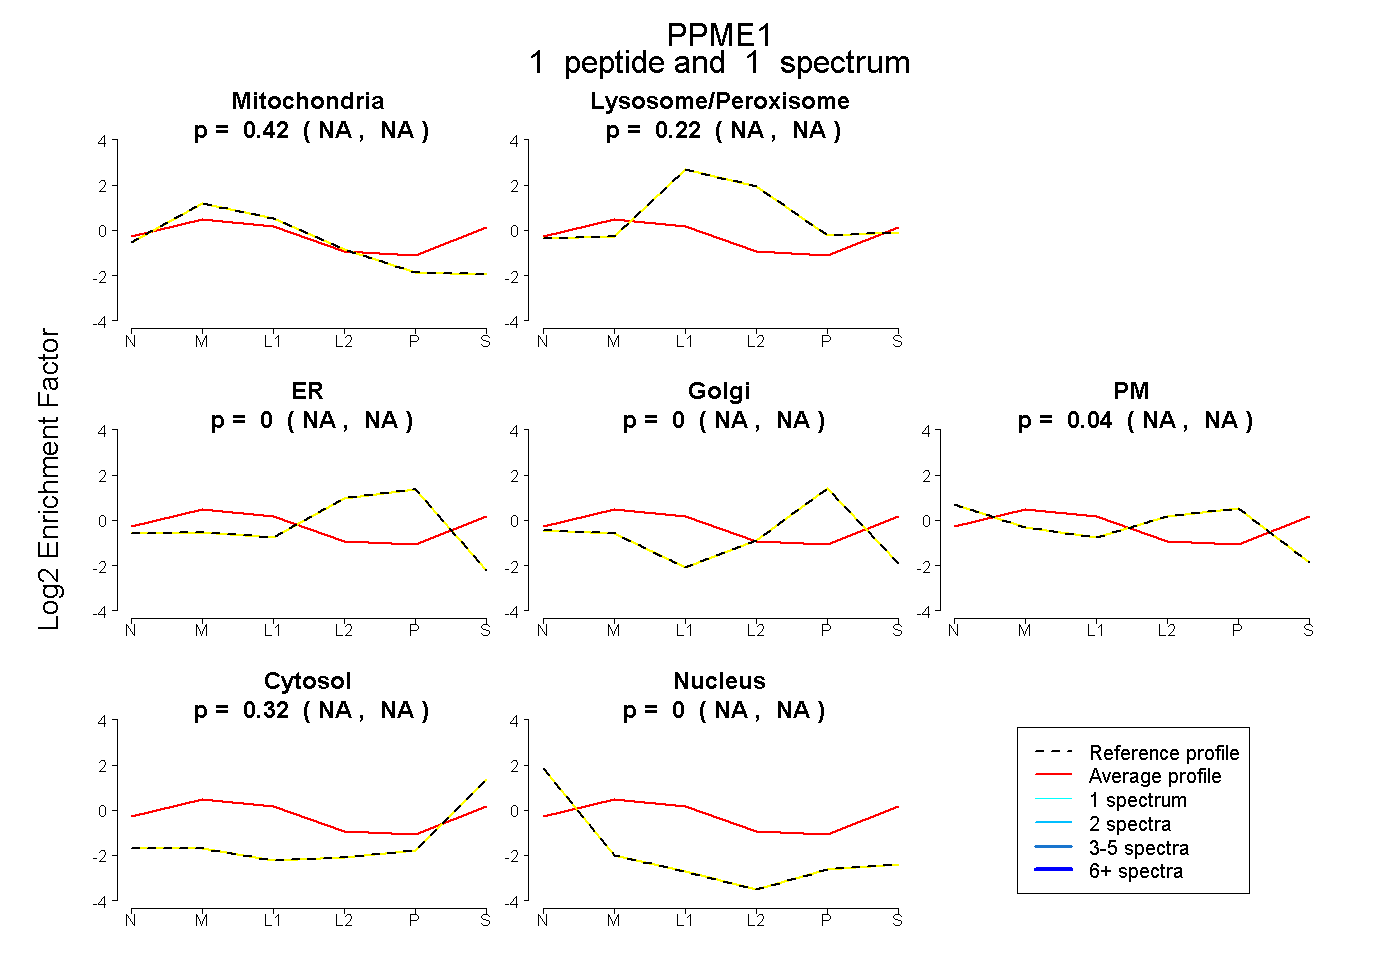 |
0.421 NA | NA |
0.218 NA | NA |
0.000 NA | NA |
0.000 NA | NA |
0.044 NA | NA |
0.317 NA | NA |
0.000 NA | NA |
|||
| Plot | Lyso | Other | |||||||||||
| Expt C |
2 peptides |
67 spectra |
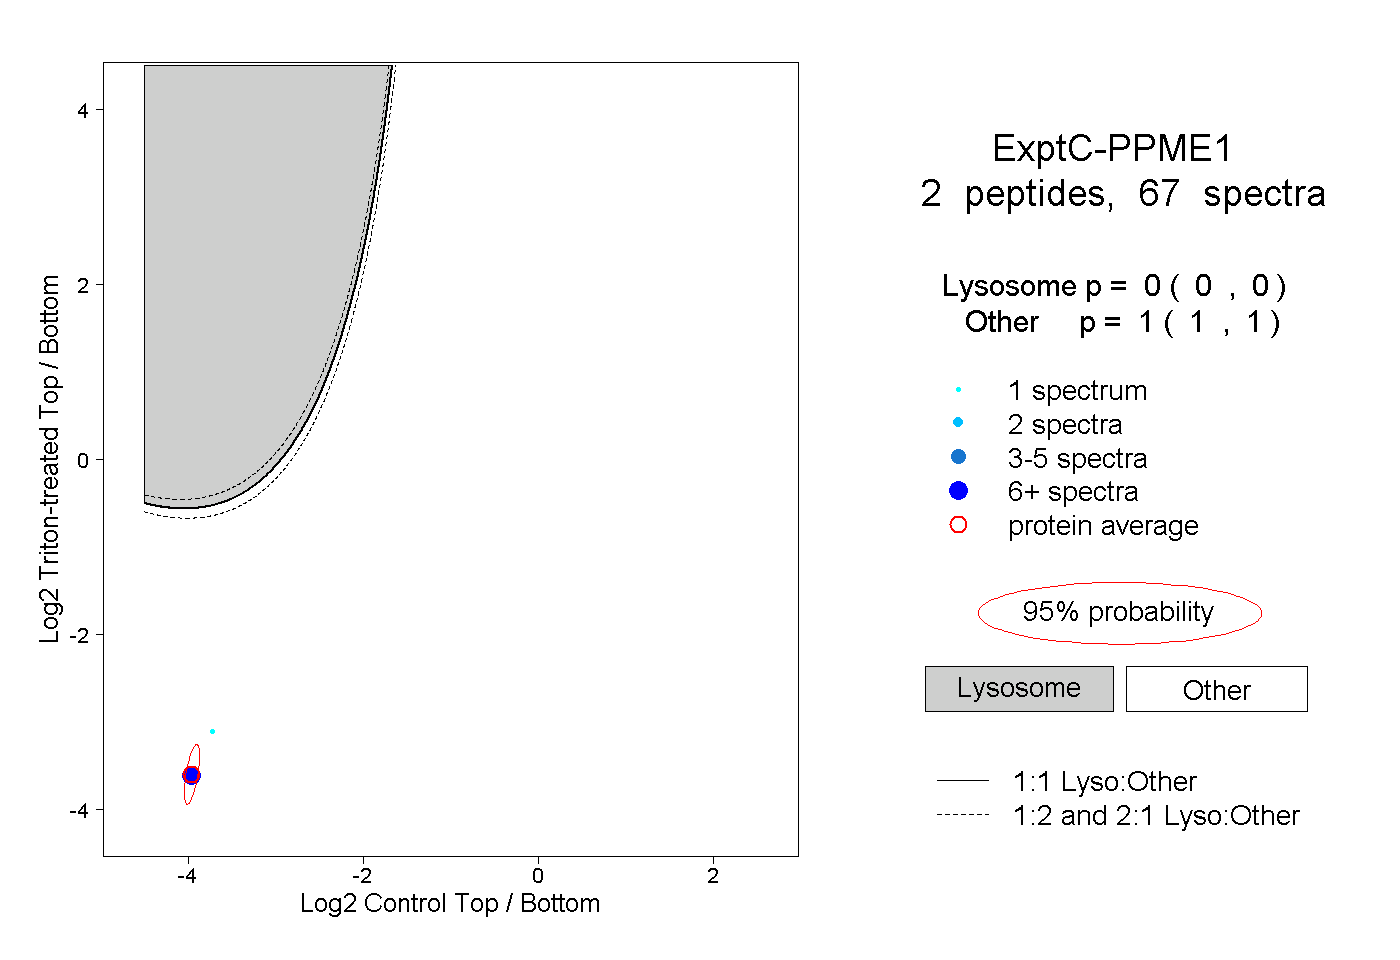 |
0.000 0.000 | 0.000 |
1.000 1.000 | 1.000 |