 10
10peptides
spectra
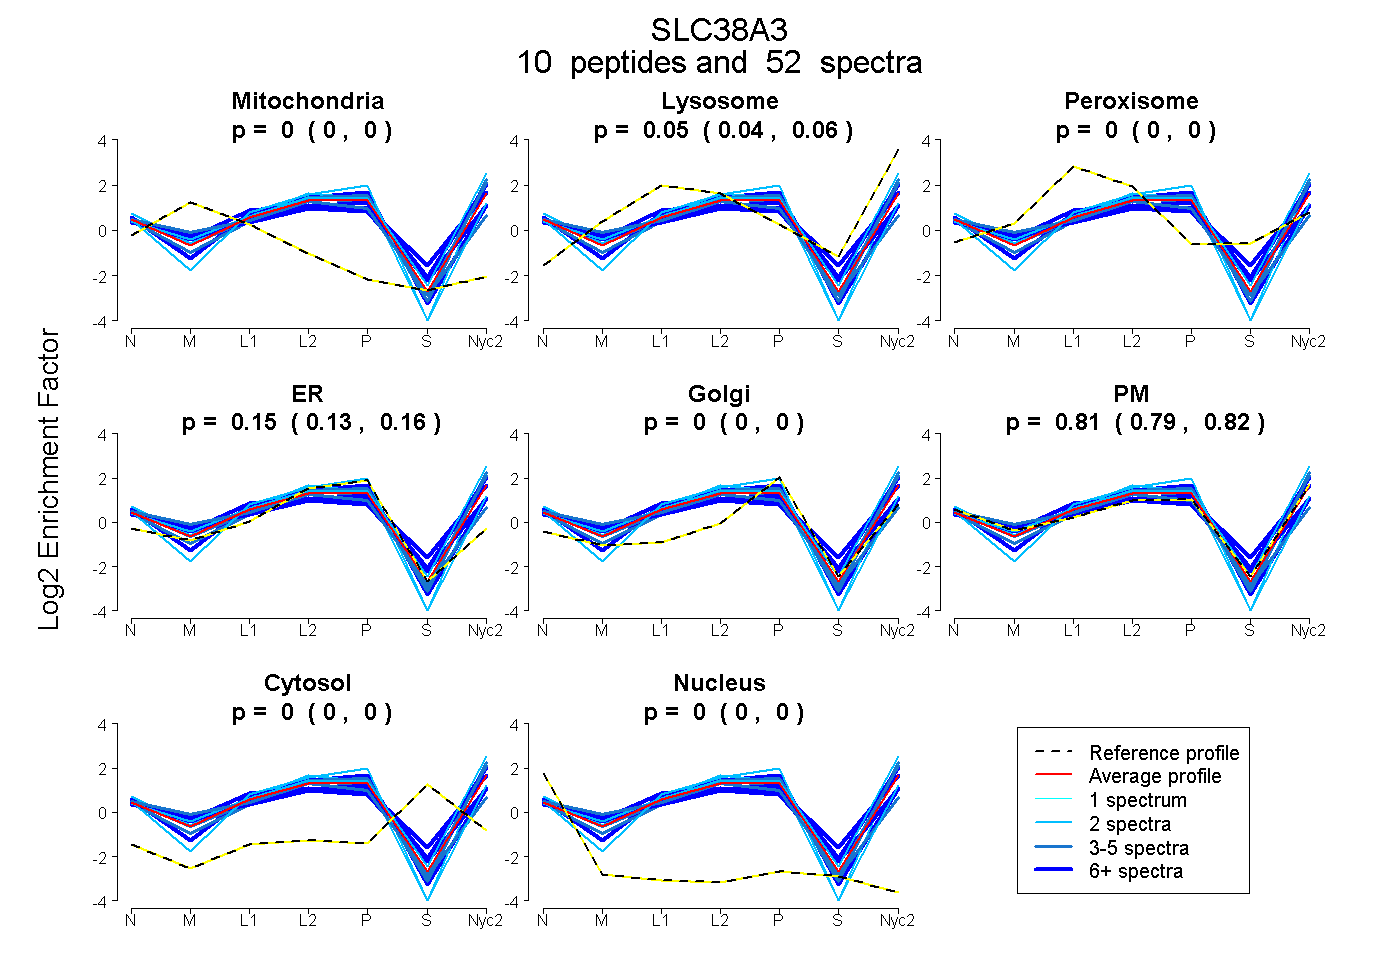
0.000 | 0.000
0.041 | 0.056
0.000 | 0.000
0.129 | 0.159
0.000 | 0.000
0.790 | 0.818
0.000 | 0.000
0.000 | 0.000
5peptides
spectra
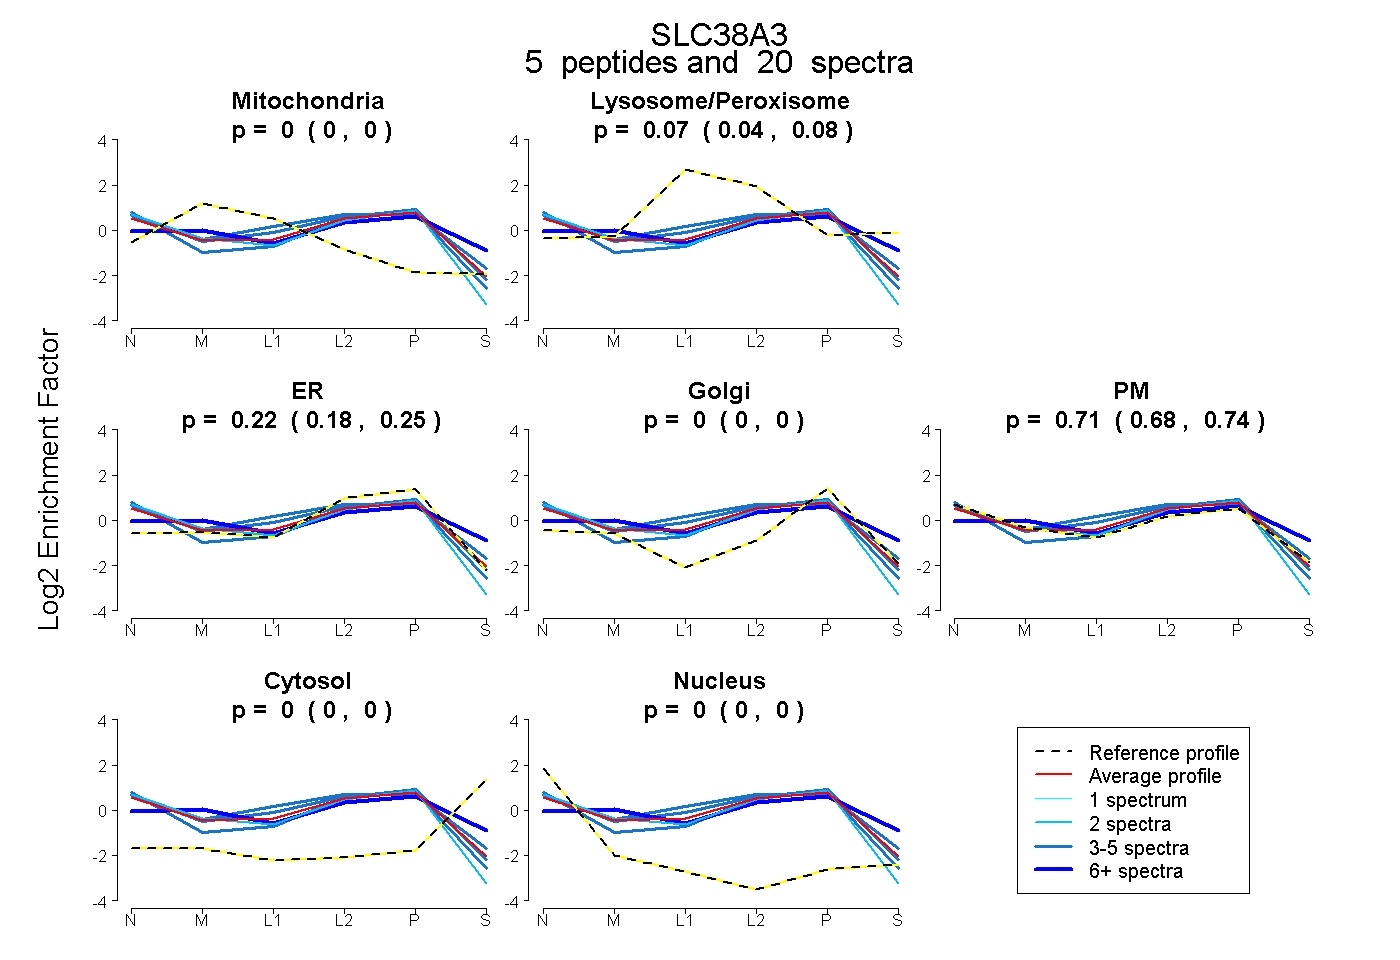
0.000 | 0.000
0.044 | 0.084
0.178 | 0.253
0.000 | 0.000
0.681 | 0.743
0.000 | 0.000
0.000 | 0.000
8peptides
spectra
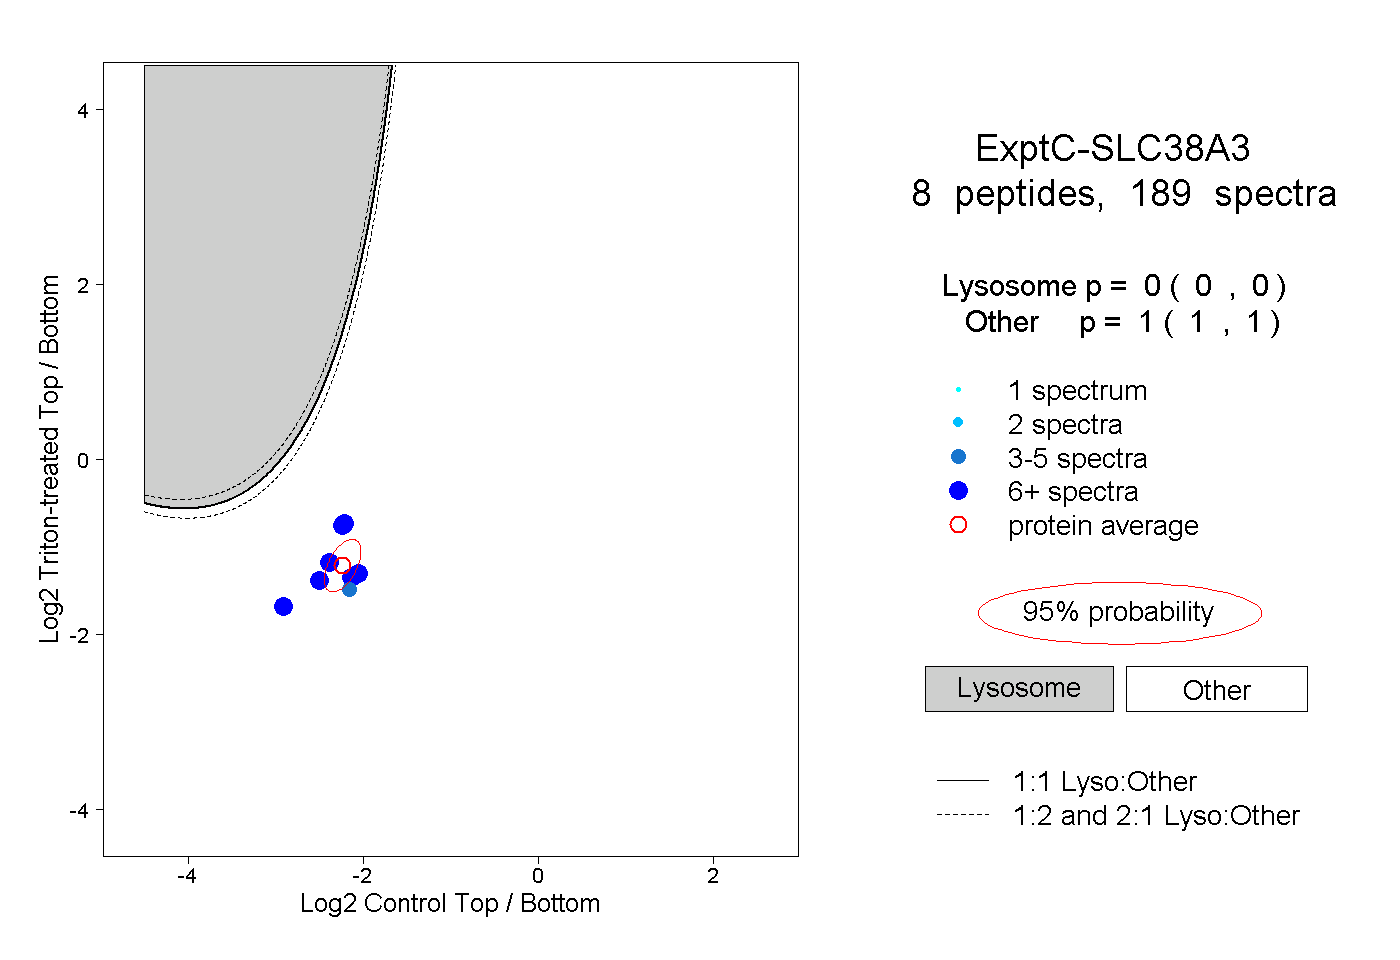
0.000 | 0.000
1.000 | 1.000
6peptides
spectra
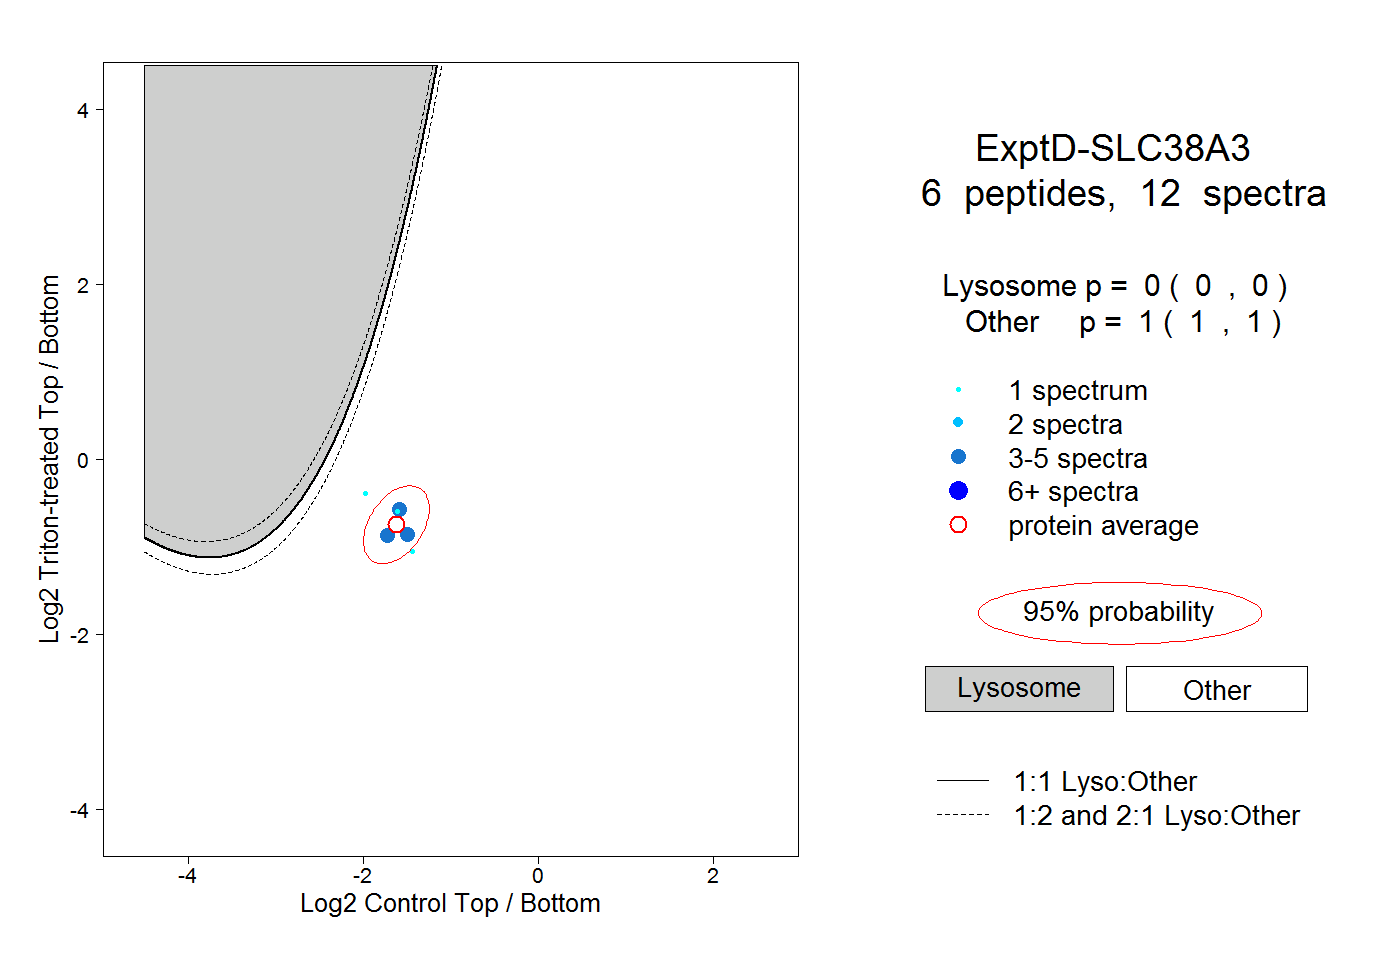
0.000 | 0.000
1.000 | 1.000