 10
10peptides
spectra
0.000 | 0.000
0.041 | 0.056
0.000 | 0.000
0.129 | 0.159
0.000 | 0.000
0.790 | 0.818
0.000 | 0.000
0.000 | 0.000
| Plot | Mito | Lyso | Perox | ER | Golgi | PM | Cytosol | Nucleus | |||||
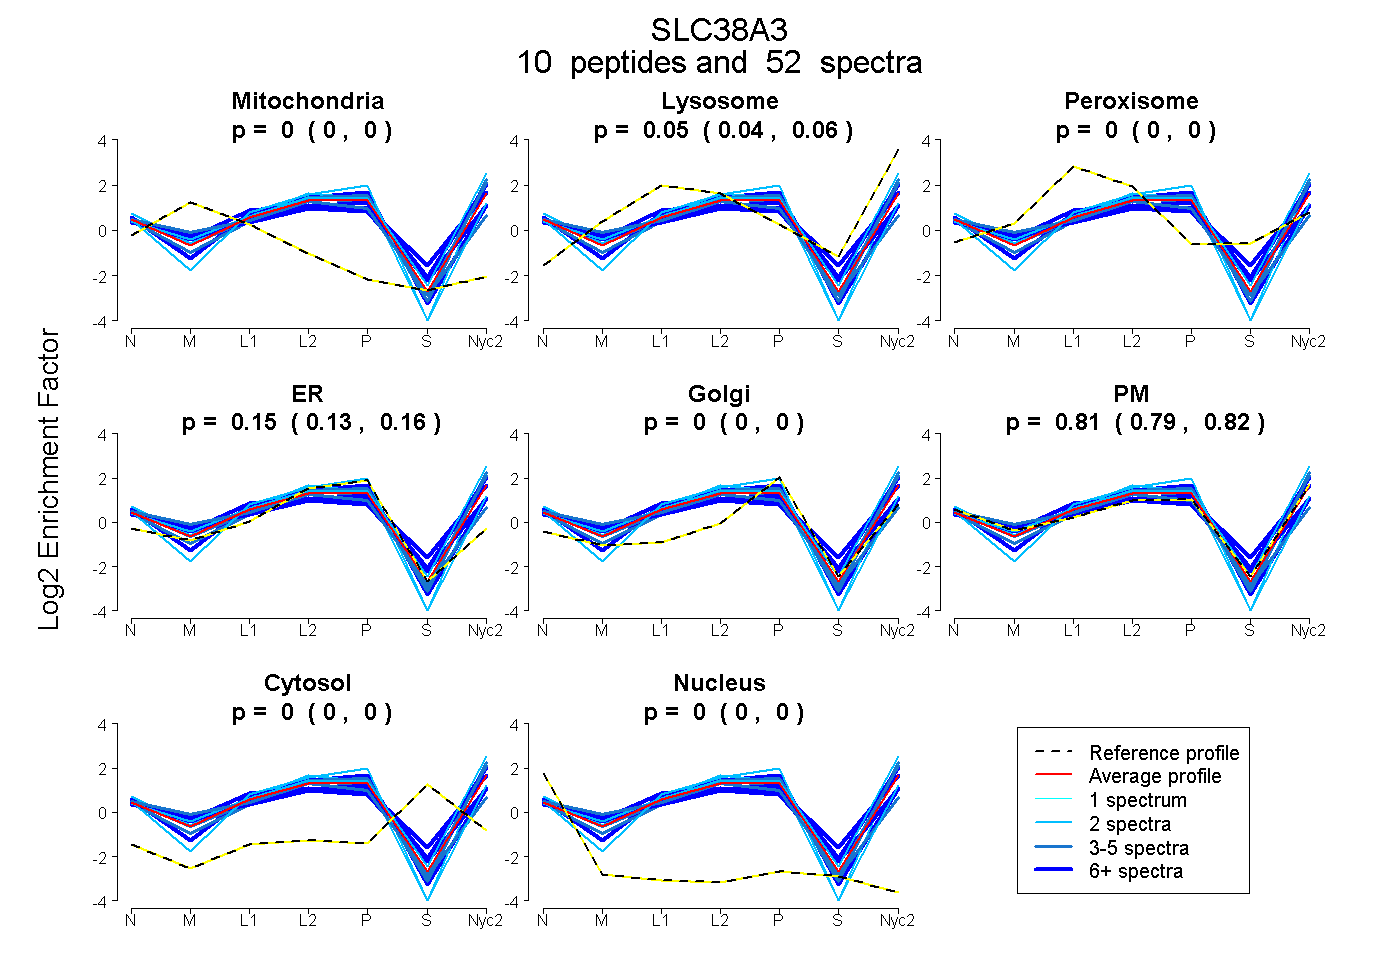
| Expt A |
10 peptides |
52 spectra |
|
0.000 0.000 | 0.000 |
0.049 0.041 | 0.056 |
0.000 0.000 | 0.000 |
0.146 0.129 | 0.159 |
0.000 0.000 | 0.000 |
0.805 0.790 | 0.818 |
0.000 0.000 | 0.000 |
0.000 0.000 | 0.000 |
| 2 spectra, IMPTEK | 0.000 | 0.182 | 0.000 | 0.000 | 0.000 | 0.818 | 0.000 | 0.000 | ||
| 2 spectra, AIQQMLFQNQEFSWLR | 0.000 | 0.000 | 0.000 | 0.000 | 0.000 | 1.000 | 0.000 | 0.000 | ||
| 10 spectra, AEDAQHCGEGK | 0.000 | 0.000 | 0.000 | 0.412 | 0.000 | 0.588 | 0.000 | 0.000 | ||
| 4 spectra, GFLQQSSSK | 0.000 | 0.000 | 0.000 | 0.532 | 0.000 | 0.468 | 0.000 | 0.000 | ||
| 8 spectra, AYEQLGYR | 0.000 | 0.129 | 0.000 | 0.000 | 0.018 | 0.853 | 0.000 | 0.000 | ||
| 8 spectra, EPHFTDFEGK | 0.000 | 0.063 | 0.194 | 0.000 | 0.032 | 0.691 | 0.019 | 0.000 | ||
| 5 spectra, SSGIVGIR | 0.000 | 0.095 | 0.000 | 0.000 | 0.000 | 0.905 | 0.000 | 0.000 | ||
| 2 spectra, QTEMVELVPNGK | 0.000 | 0.000 | 0.000 | 0.510 | 0.000 | 0.490 | 0.000 | 0.000 | ||
| 5 spectra, AFGTPGK | 0.000 | 0.039 | 0.000 | 0.000 | 0.000 | 0.961 | 0.000 | 0.000 | ||
| 6 spectra, HLEGLLPVGMPTADTQR | 0.068 | 0.000 | 0.084 | 0.115 | 0.000 | 0.723 | 0.009 | 0.000 |
| Plot | Mito | Lyso or Perox | ER | Golgi | PM | Cytosol | Nucleus | ||||||
| Expt B |
5 peptides |
20 spectra |
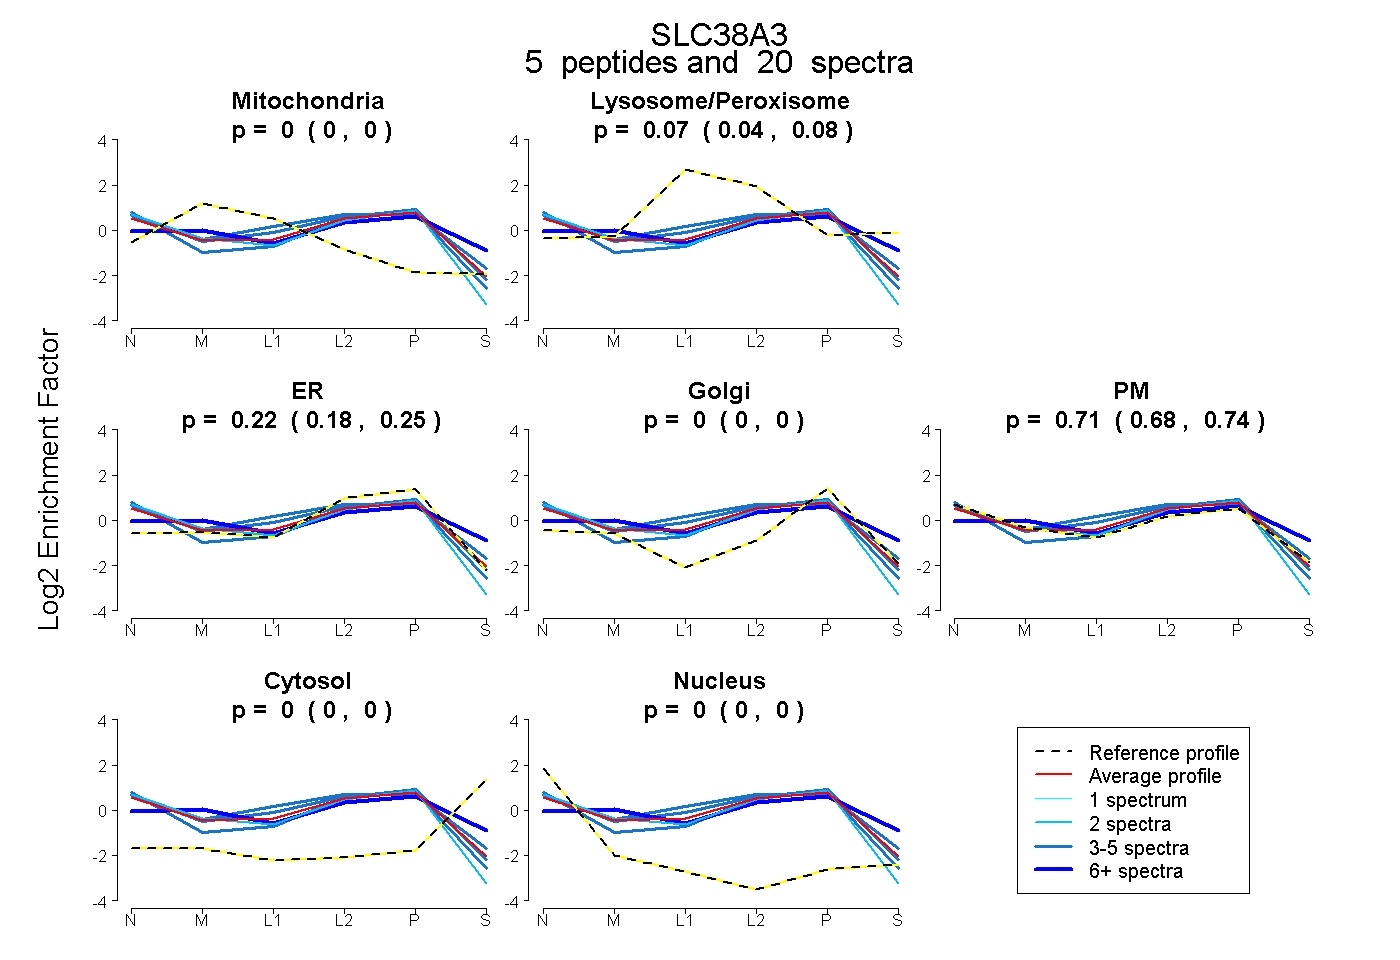 |
0.000 0.000 | 0.000 |
0.066 0.044 | 0.084 |
0.219 0.178 | 0.253 |
0.000 0.000 | 0.000 |
0.715 0.681 | 0.743 |
0.000 0.000 | 0.000 |
0.000 0.000 | 0.000 |
|||
| Plot | Lyso | Other | |||||||||||
| Expt C |
8 peptides |
189 spectra |
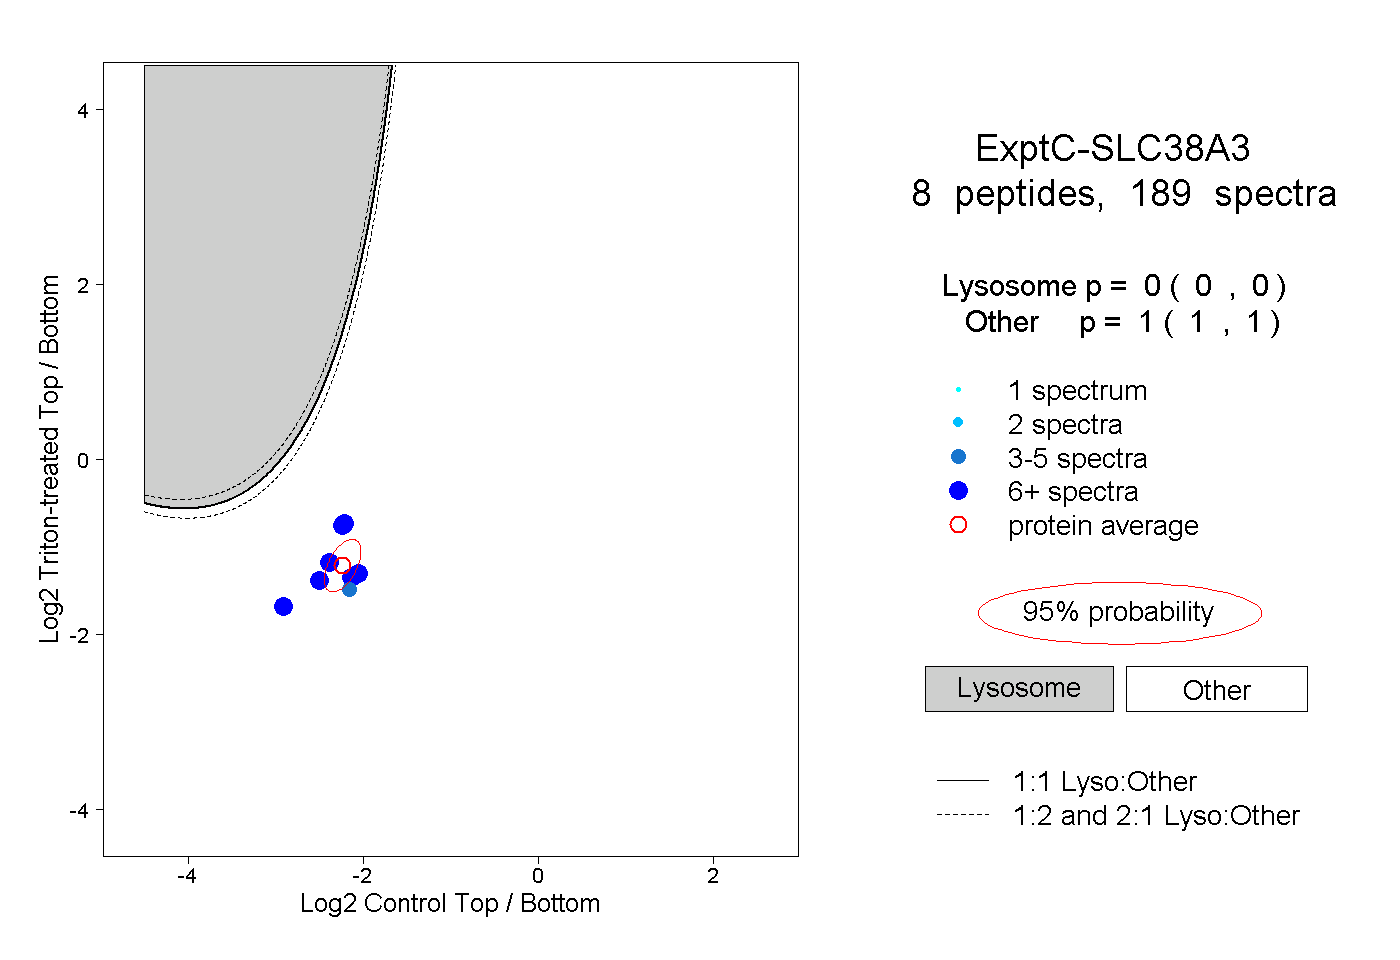 |
0.000 0.000 | 0.000 |
1.000 1.000 | 1.000 |
||||||||
| Plot | Lyso | Other | |||||||||||
| Expt D |
6 peptides |
12 spectra |
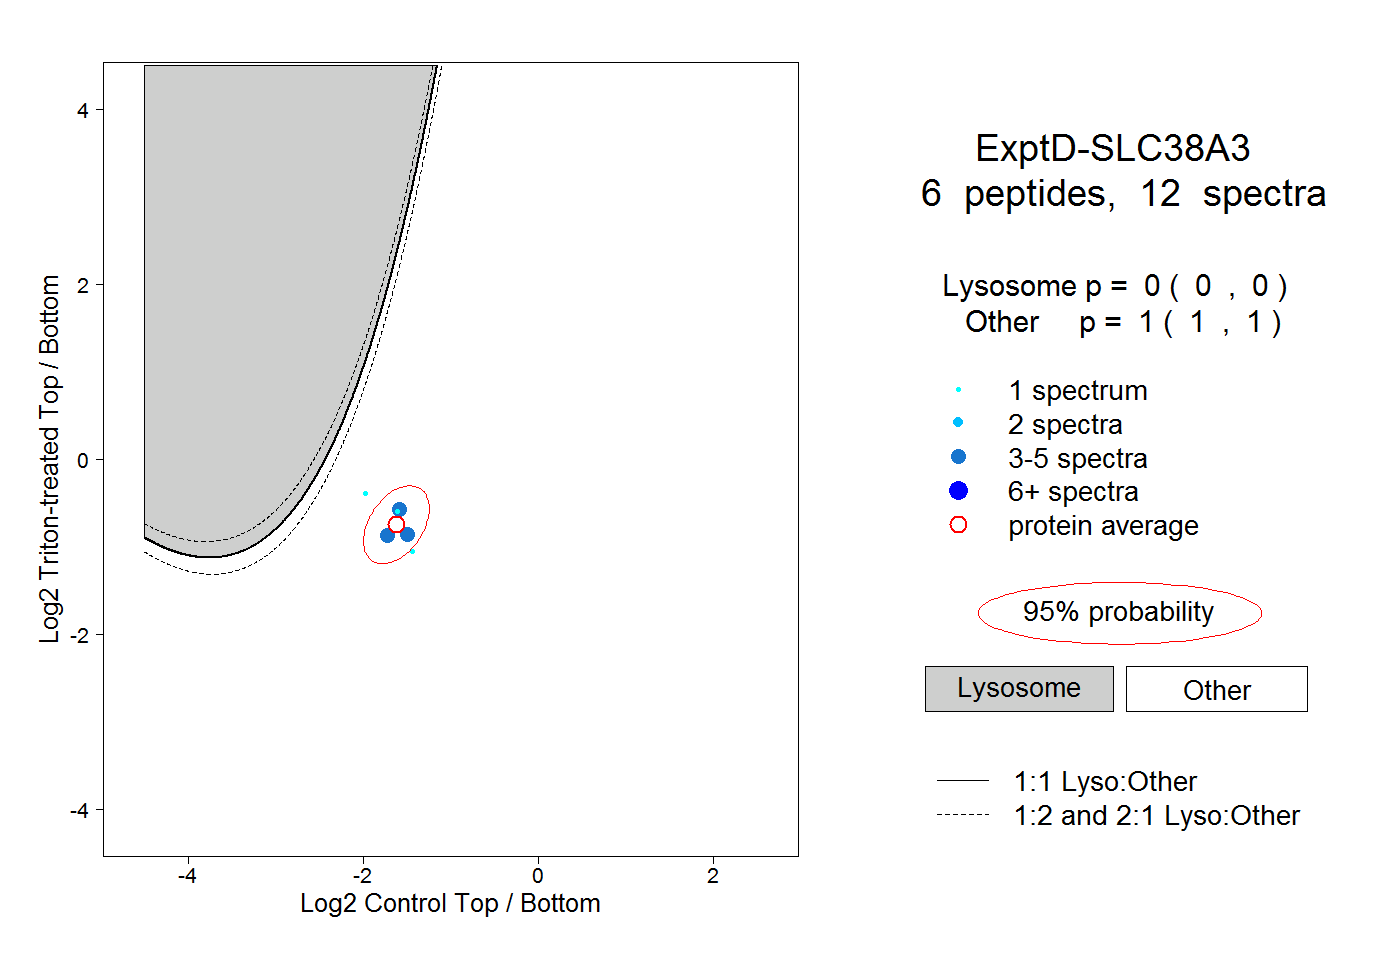 |
0.000 0.000 | 0.000 |
1.000 1.000 | 1.000 |