 7
7peptides
spectra
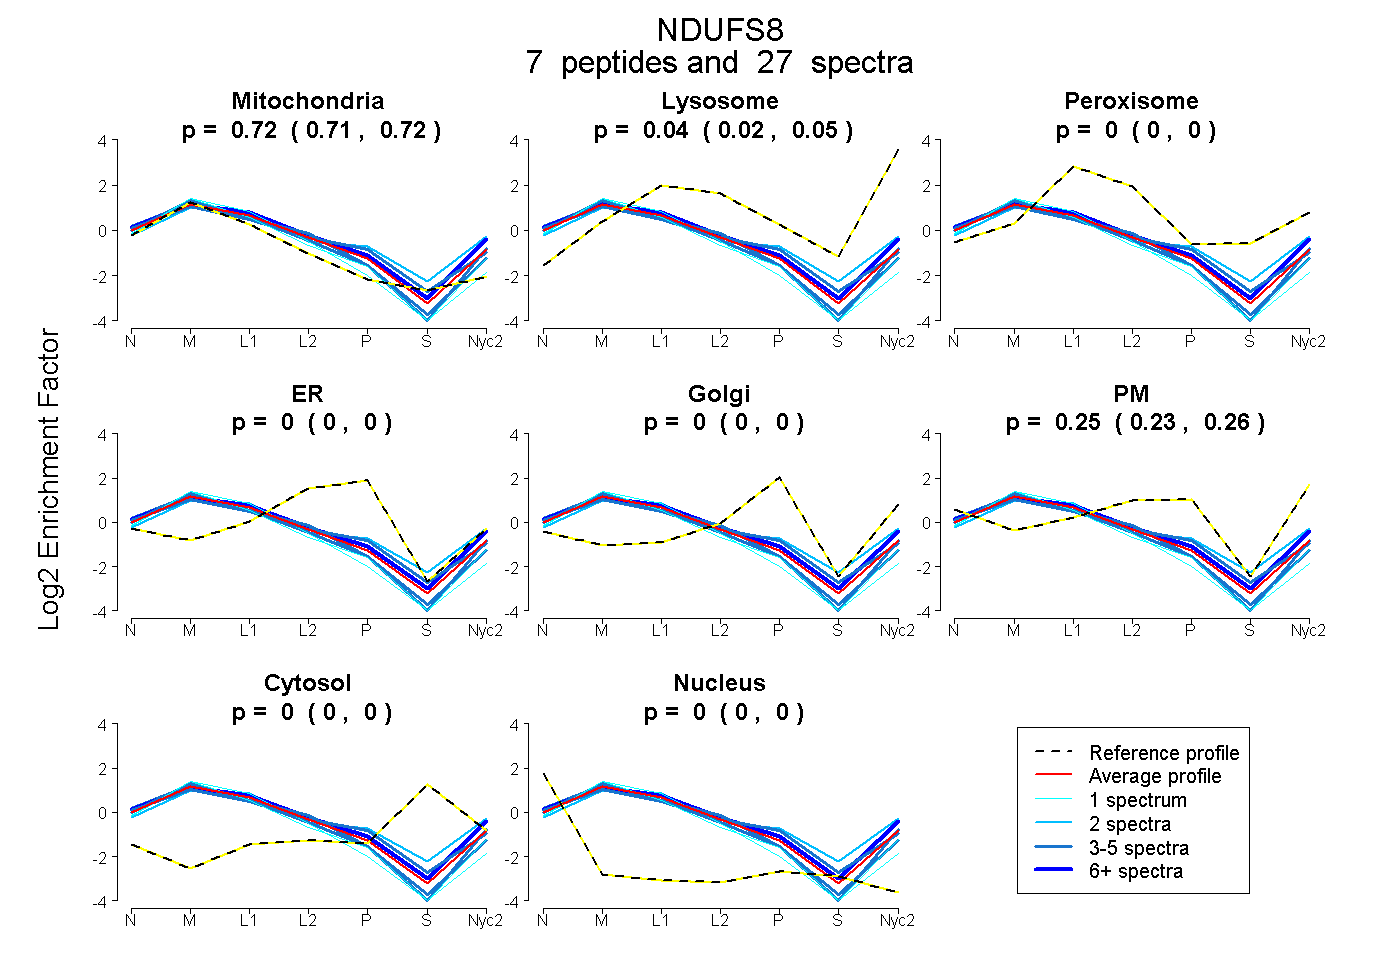
0.706 | 0.725
0.024 | 0.048
0.000 | 0.000
0.000 | 0.000
0.000 | 0.000
0.232 | 0.259
0.000 | 0.000
0.000 | 0.000
5peptides
spectra
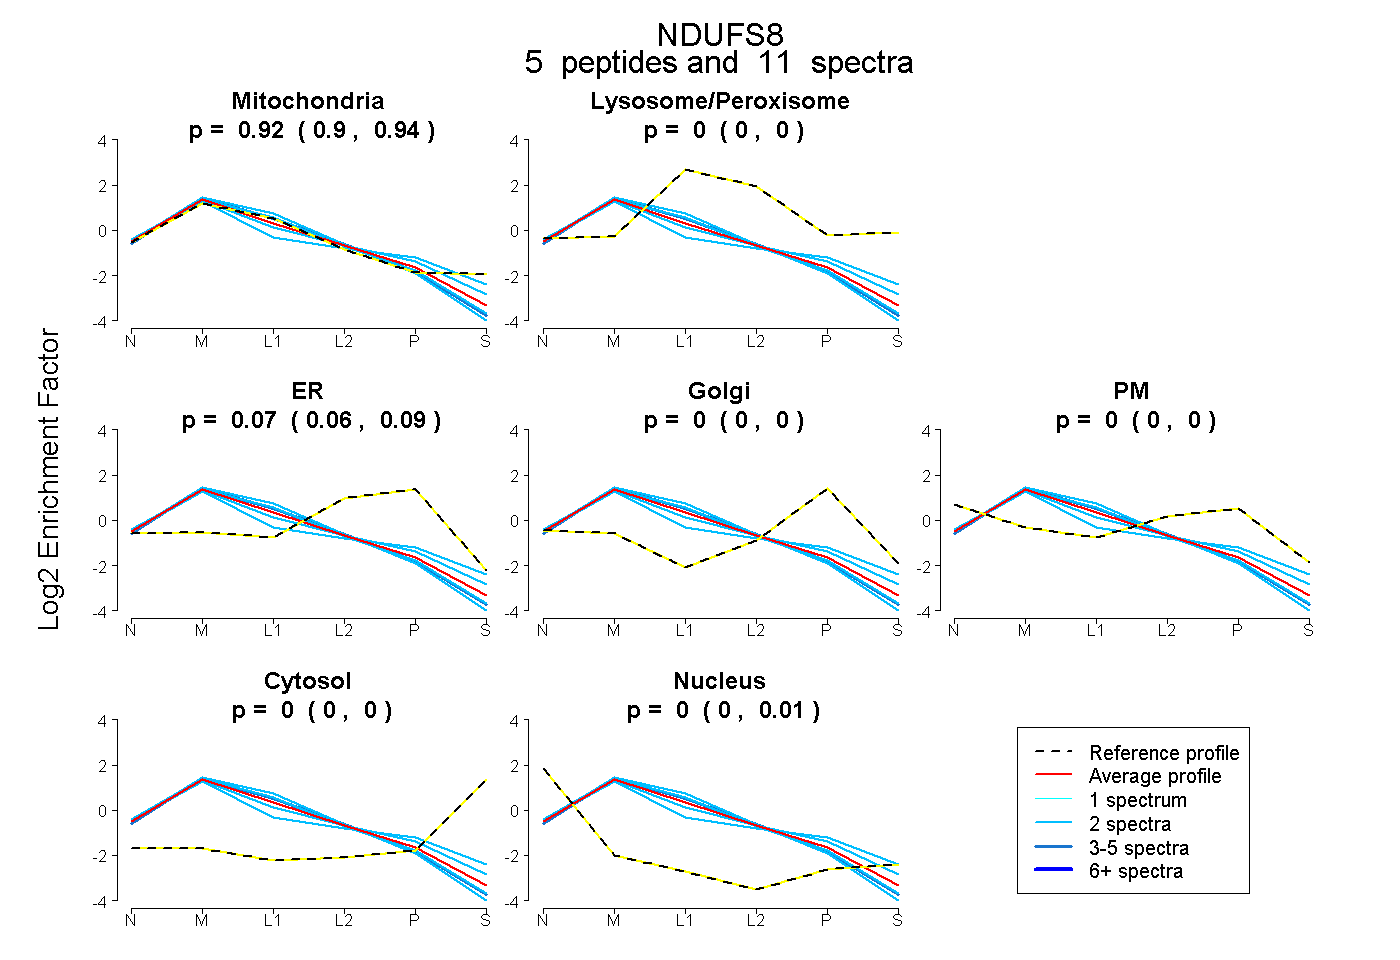
0.900 | 0.939
0.000 | 0.000
0.056 | 0.087
0.000 | 0.000
0.000 | 0.000
0.000 | 0.000
0.000 | 0.014
9peptides
spectra
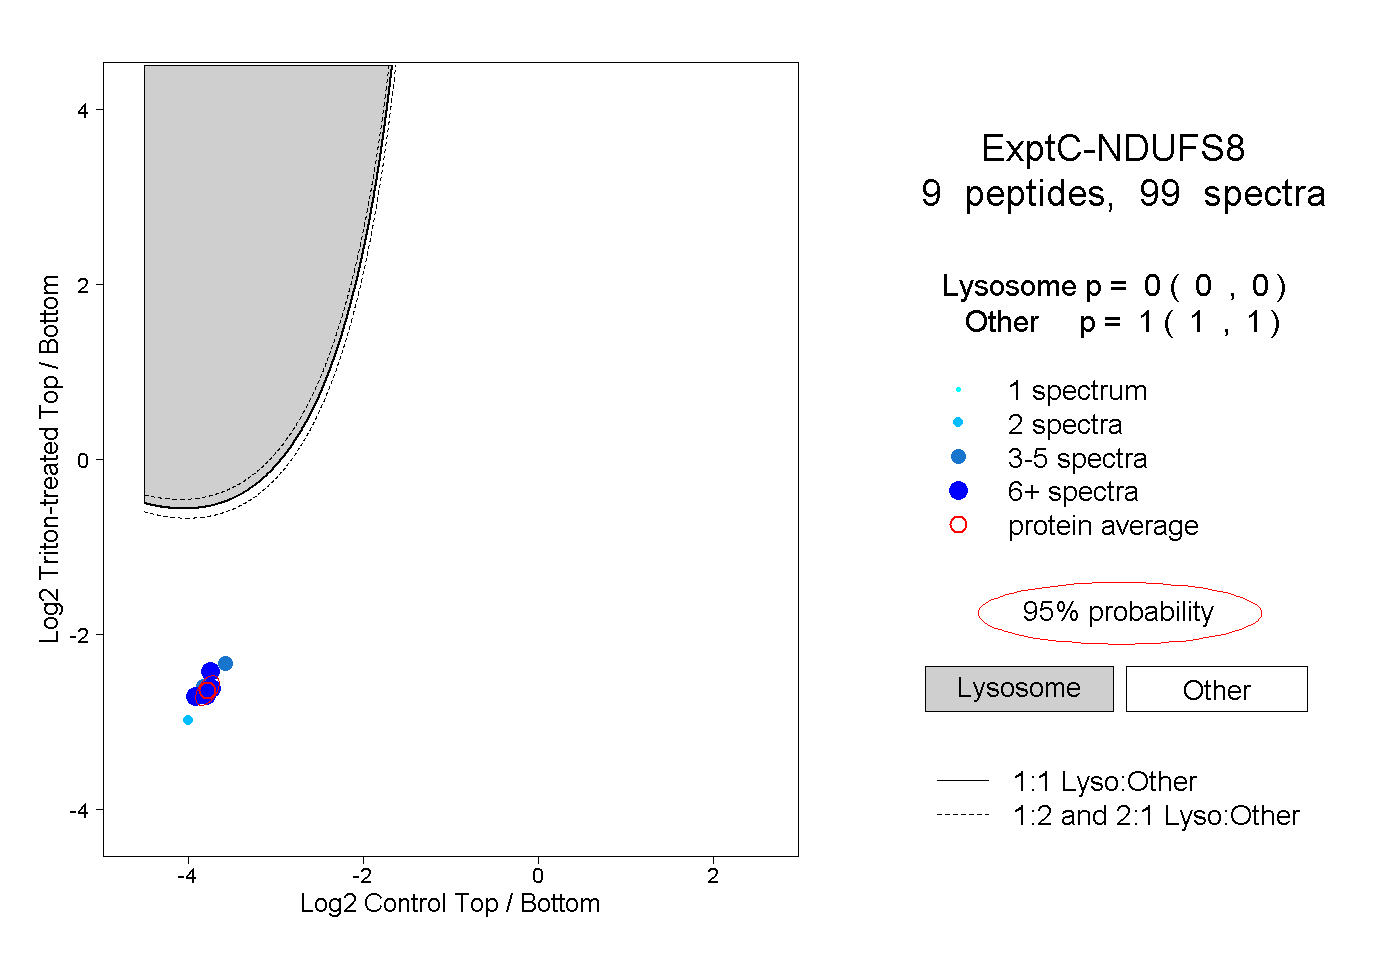
0.000 | 0.000
1.000 | 1.000
4peptides
spectra
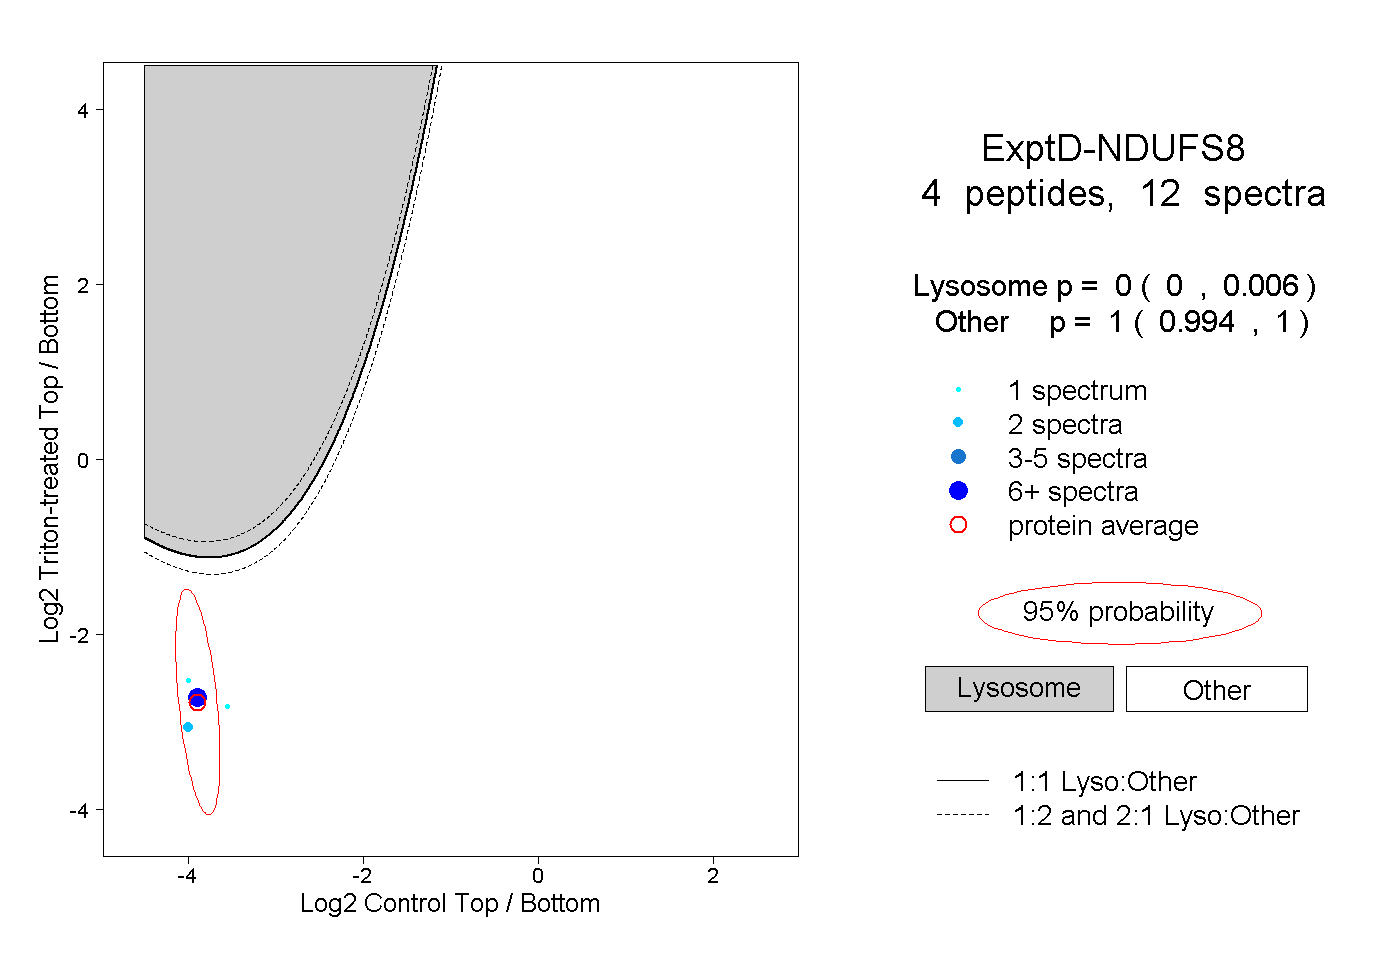
0.000 | 0.006
0.994 | 1.000