 7
7peptides
spectra
0.706 | 0.725
0.024 | 0.048
0.000 | 0.000
0.000 | 0.000
0.000 | 0.000
0.232 | 0.259
0.000 | 0.000
0.000 | 0.000
| Plot | Mito | Lyso | Perox | ER | Golgi | PM | Cytosol | Nucleus | |||||
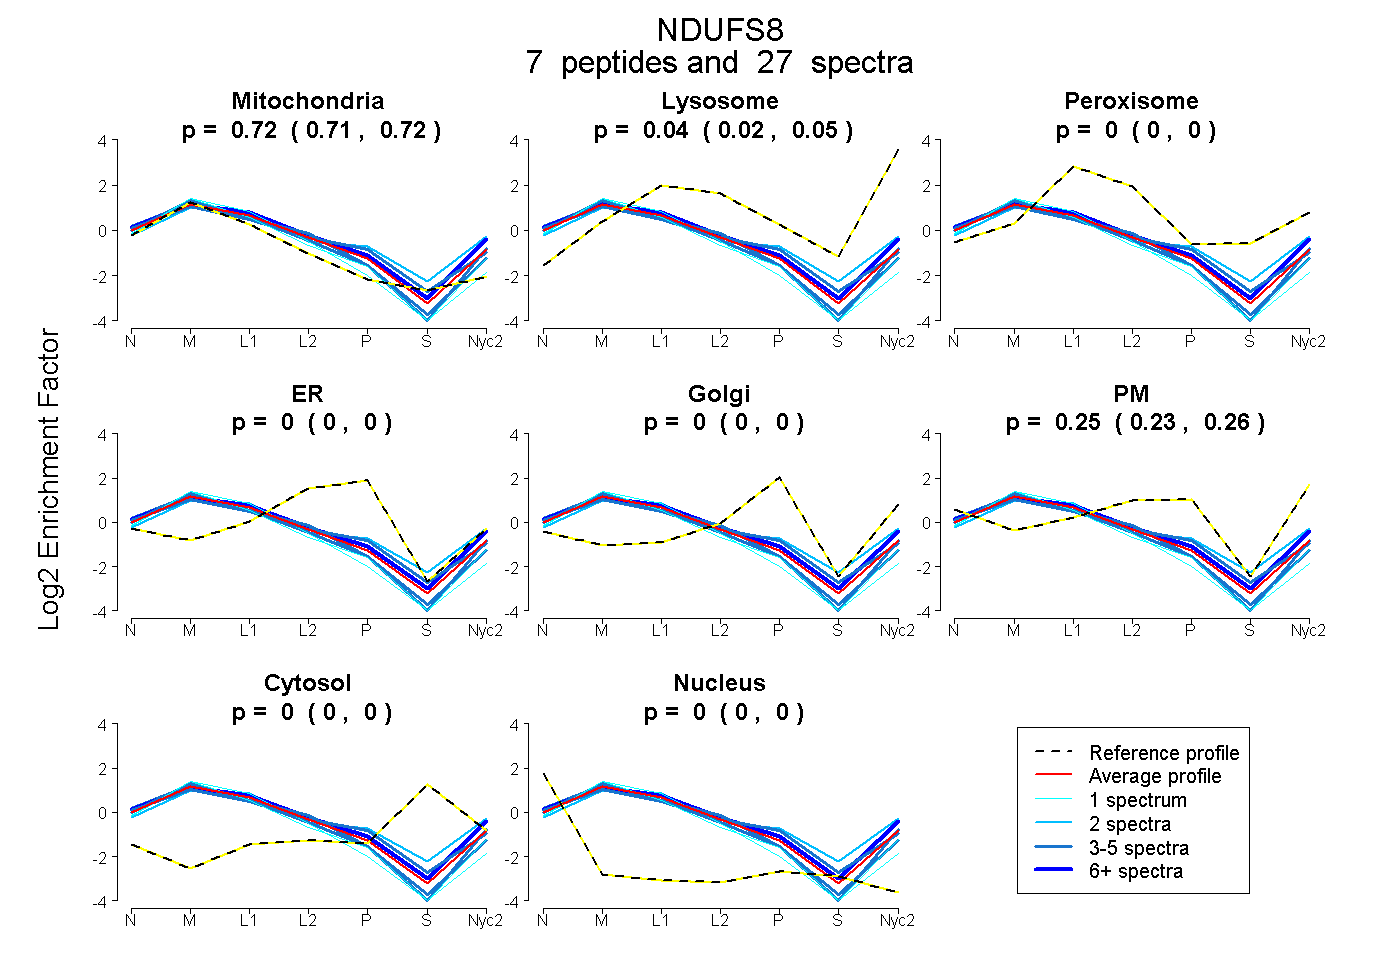
| Expt A |
7 peptides |
27 spectra |
|
0.716 0.706 | 0.725 |
0.037 0.024 | 0.048 |
0.000 0.000 | 0.000 |
0.000 0.000 | 0.000 |
0.000 0.000 | 0.000 |
0.247 0.232 | 0.259 |
0.000 0.000 | 0.000 |
0.000 0.000 | 0.000 |
| 12 spectra, GPLSPR | 0.644 | 0.087 | 0.000 | 0.000 | 0.000 | 0.269 | 0.000 | 0.000 | ||
| 4 spectra, GLGMTLSYLFR | 0.799 | 0.000 | 0.000 | 0.000 | 0.000 | 0.201 | 0.000 | 0.000 | ||
| 1 spectrum, LCEAICPAQAITIEAEPR | 0.933 | 0.000 | 0.000 | 0.067 | 0.000 | 0.000 | 0.000 | 0.000 | ||
| 4 spectra, SATDSAAR | 0.662 | 0.000 | 0.020 | 0.069 | 0.000 | 0.249 | 0.000 | 0.000 | ||
| 3 spectra, ILMWTELFR | 0.738 | 0.000 | 0.000 | 0.000 | 0.000 | 0.262 | 0.000 | 0.000 | ||
| 2 spectra, AQELDVDMK | 0.601 | 0.183 | 0.025 | 0.000 | 0.054 | 0.137 | 0.000 | 0.000 | ||
| 1 spectrum, YDIDMTK | 0.838 | 0.000 | 0.000 | 0.000 | 0.000 | 0.162 | 0.000 | 0.000 |
| Plot | Mito | Lyso or Perox | ER | Golgi | PM | Cytosol | Nucleus | ||||||
| Expt B |
5 peptides |
11 spectra |
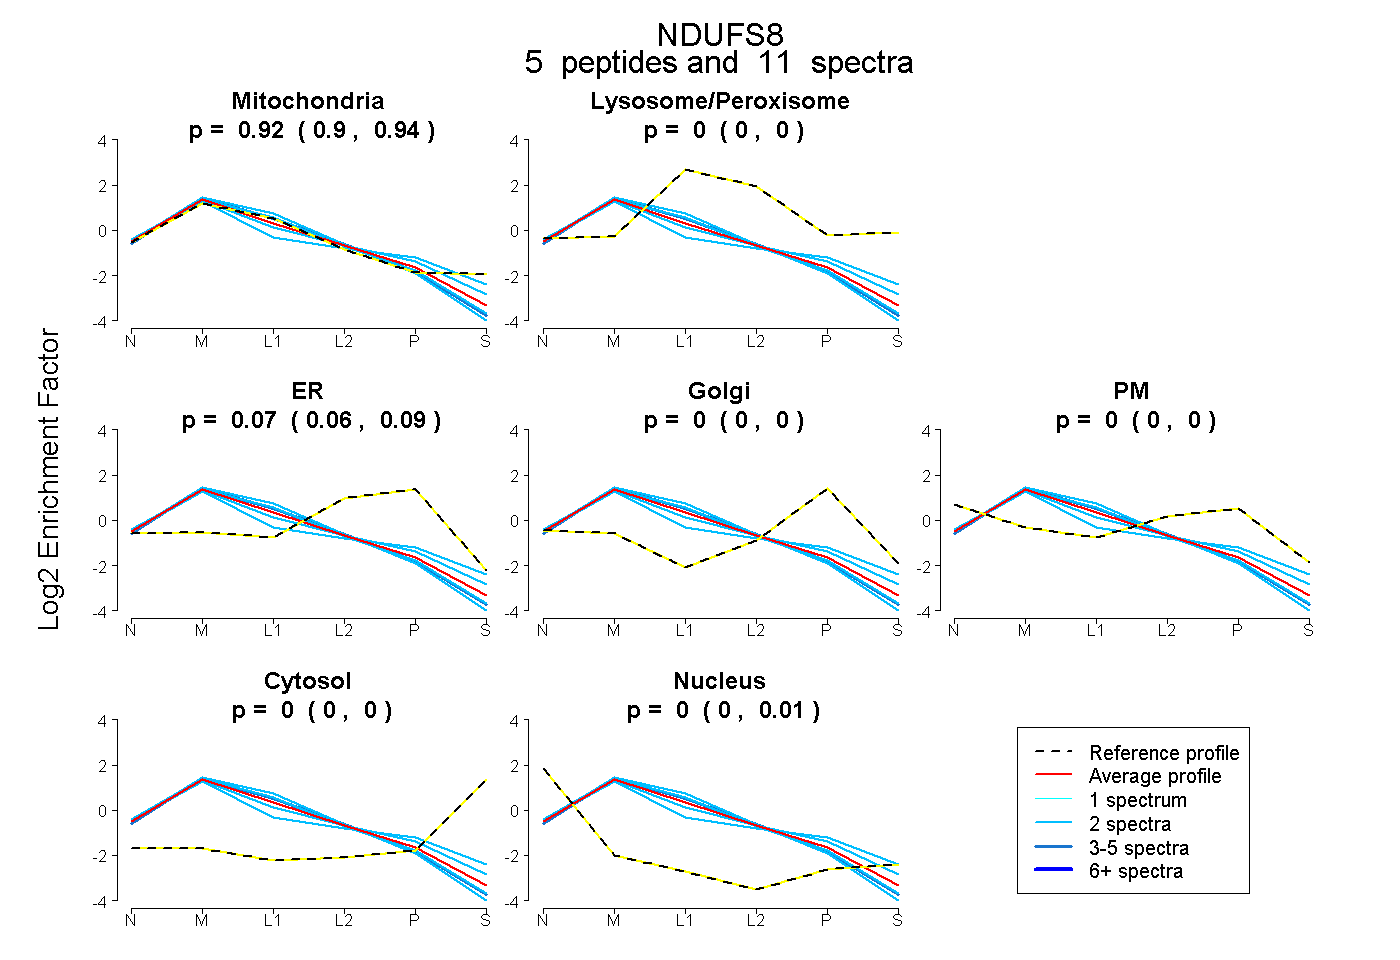 |
0.924 0.900 | 0.939 |
0.000 0.000 | 0.000 |
0.072 0.056 | 0.087 |
0.000 0.000 | 0.000 |
0.000 0.000 | 0.000 |
0.000 0.000 | 0.000 |
0.004 0.000 | 0.014 |
|||
| Plot | Lyso | Other | |||||||||||
| Expt C |
9 peptides |
99 spectra |
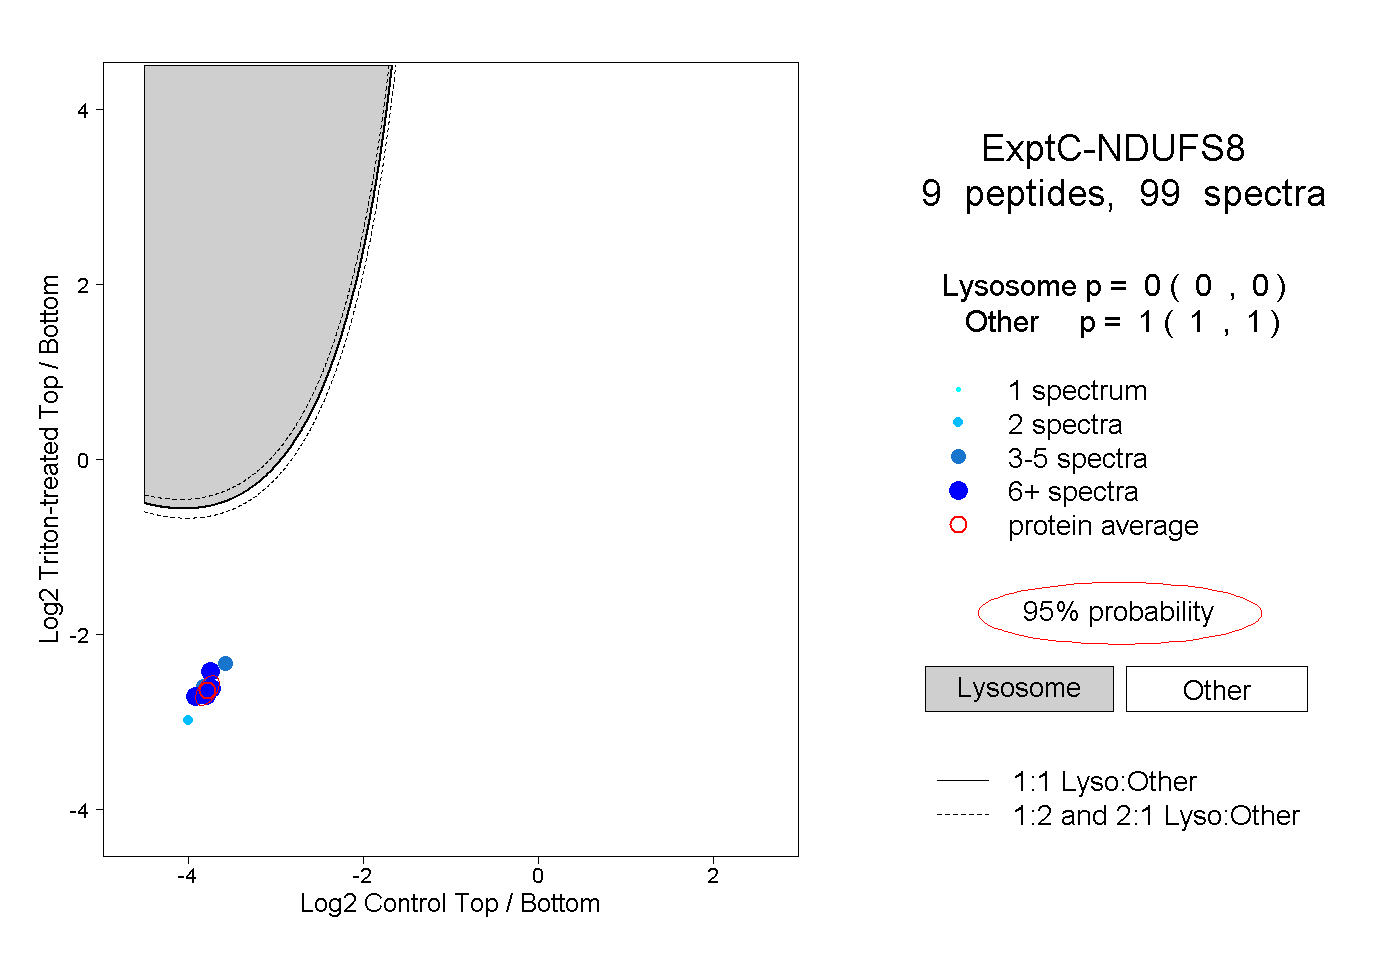 |
0.000 0.000 | 0.000 |
1.000 1.000 | 1.000 |
||||||||
| Plot | Lyso | Other | |||||||||||
| Expt D |
4 peptides |
12 spectra |
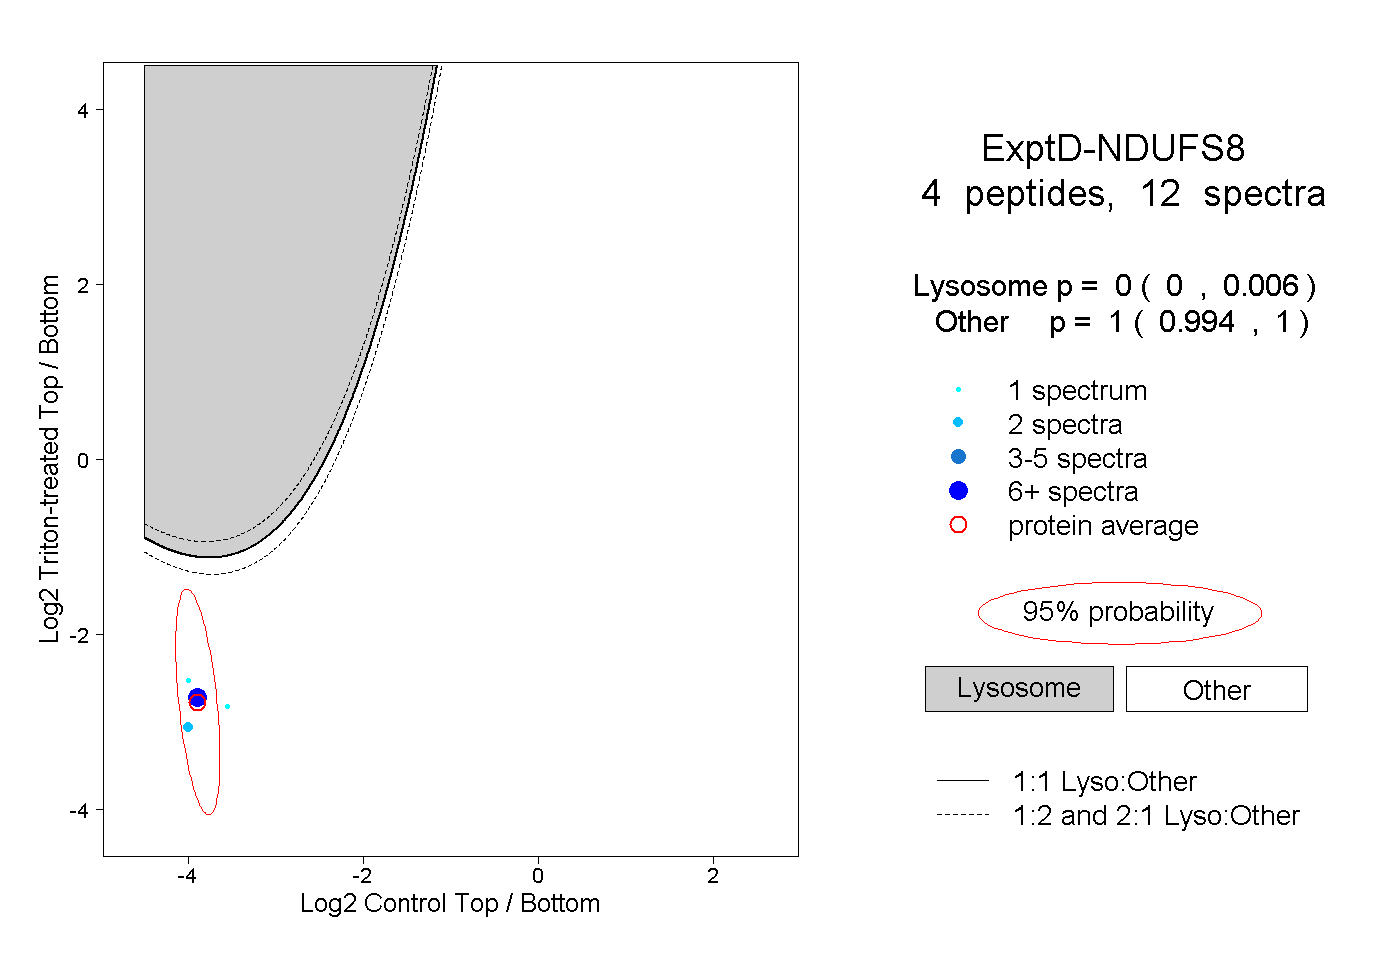 |
0.000 0.000 | 0.006 |
1.000 0.994 | 1.000 |