 16
16peptides
spectra
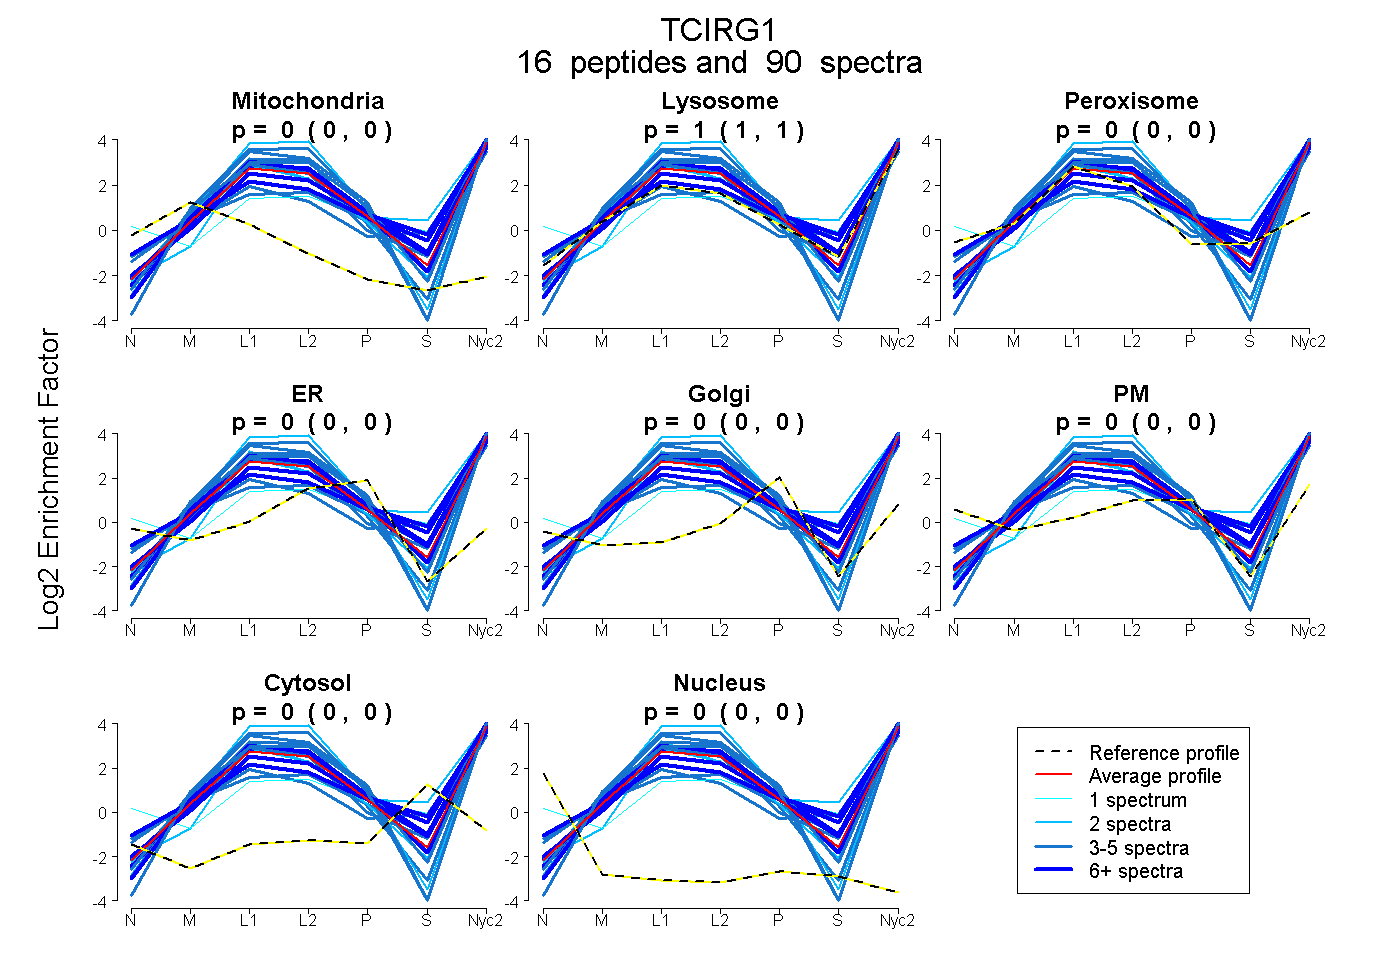
0.000 | 0.000
1.000 | 1.000
0.000 | 0.000
0.000 | 0.000
0.000 | 0.000
0.000 | 0.000
0.000 | 0.000
0.000 | 0.000
18peptides
spectra
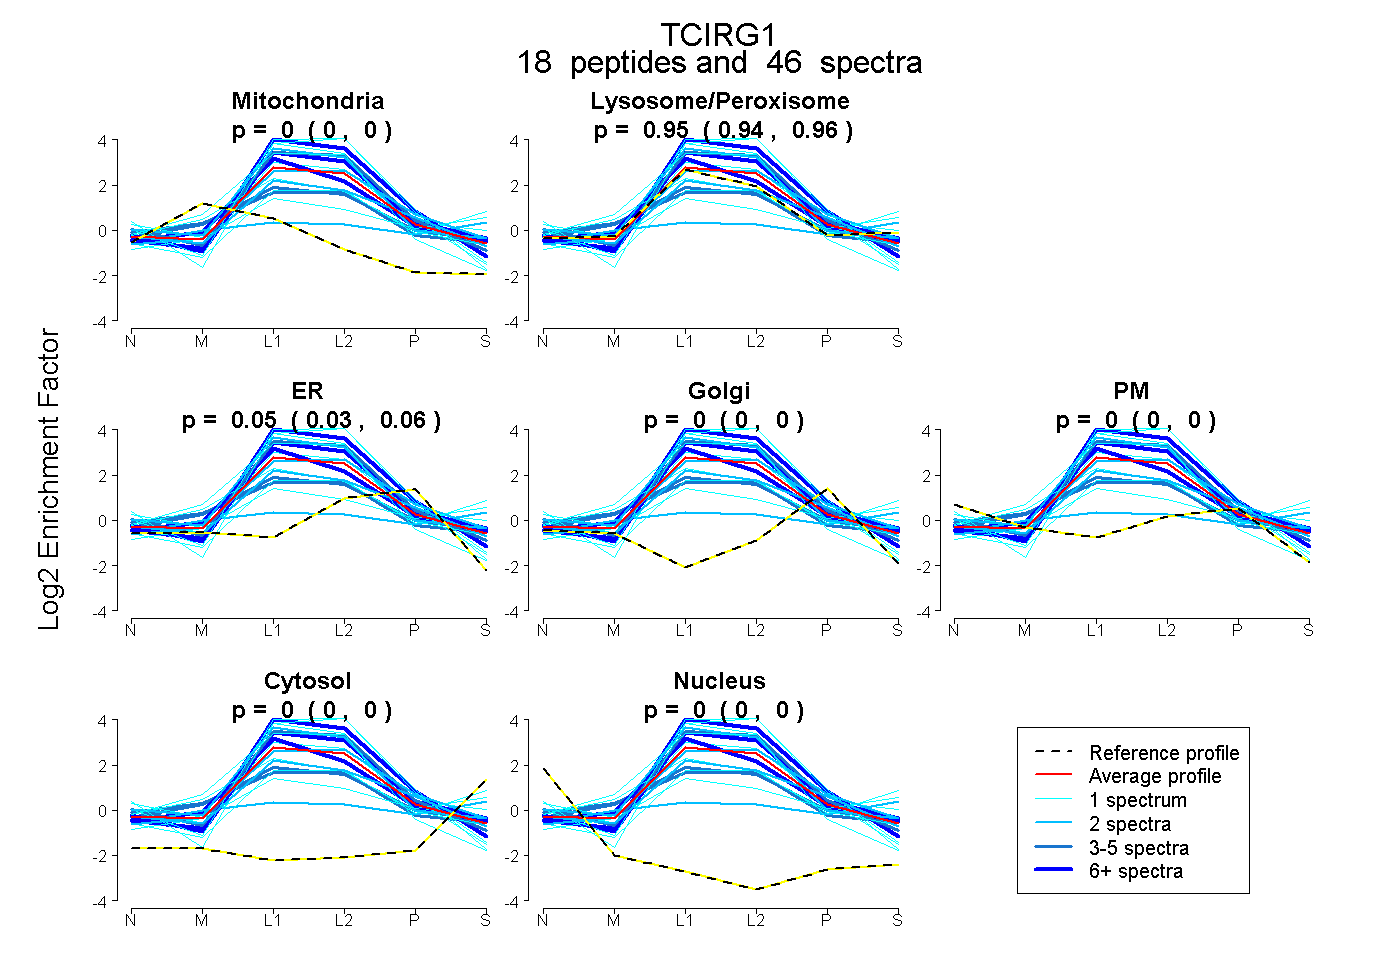
0.000 | 0.000
0.939 | 0.965
0.033 | 0.059
0.000 | 0.000
0.000 | 0.000
0.000 | 0.000
0.000 | 0.000
24peptides
spectra
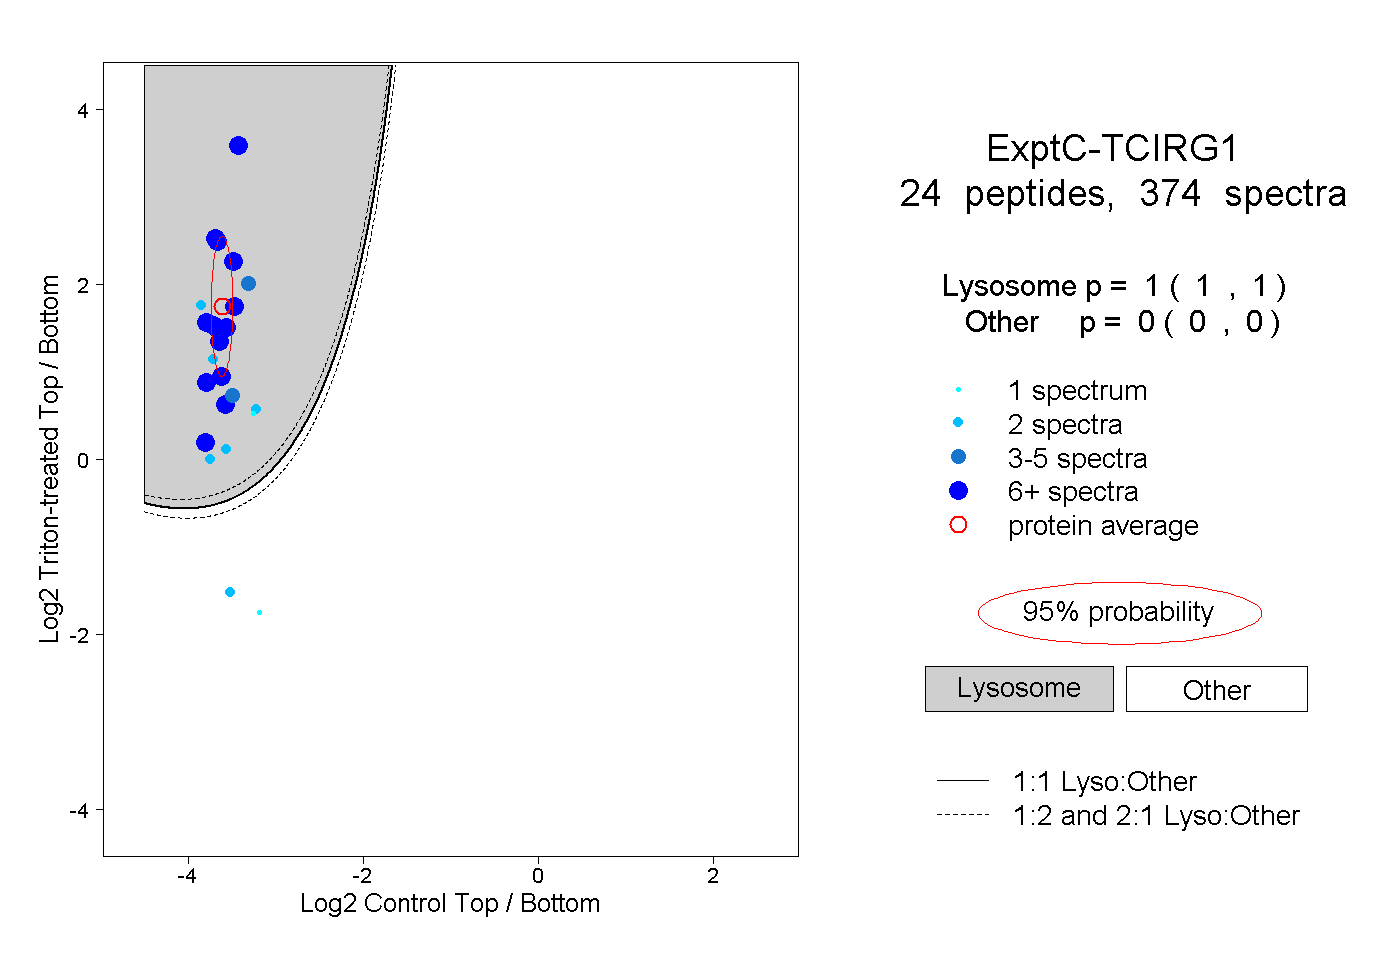
1.000 | 1.000
0.000 | 0.000
13peptides
spectra
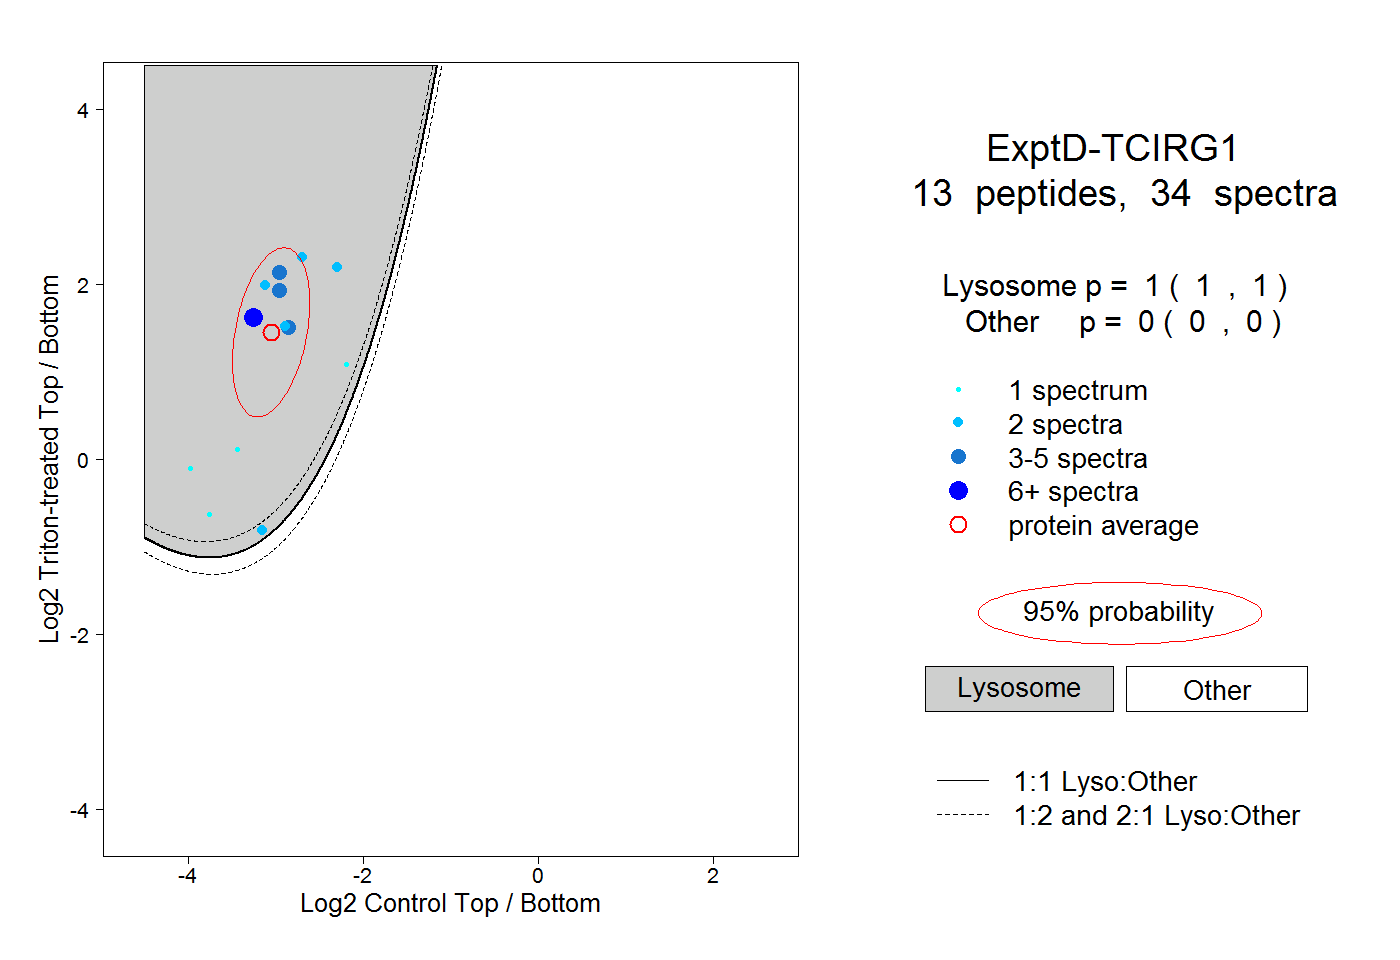
1.000 | 1.000
0.000 | 0.000