 16
16peptides
spectra
0.000 | 0.000
1.000 | 1.000
0.000 | 0.000
0.000 | 0.000
0.000 | 0.000
0.000 | 0.000
0.000 | 0.000
0.000 | 0.000
| Plot | Mito | Lyso | Perox | ER | Golgi | PM | Cytosol | Nucleus | |||||
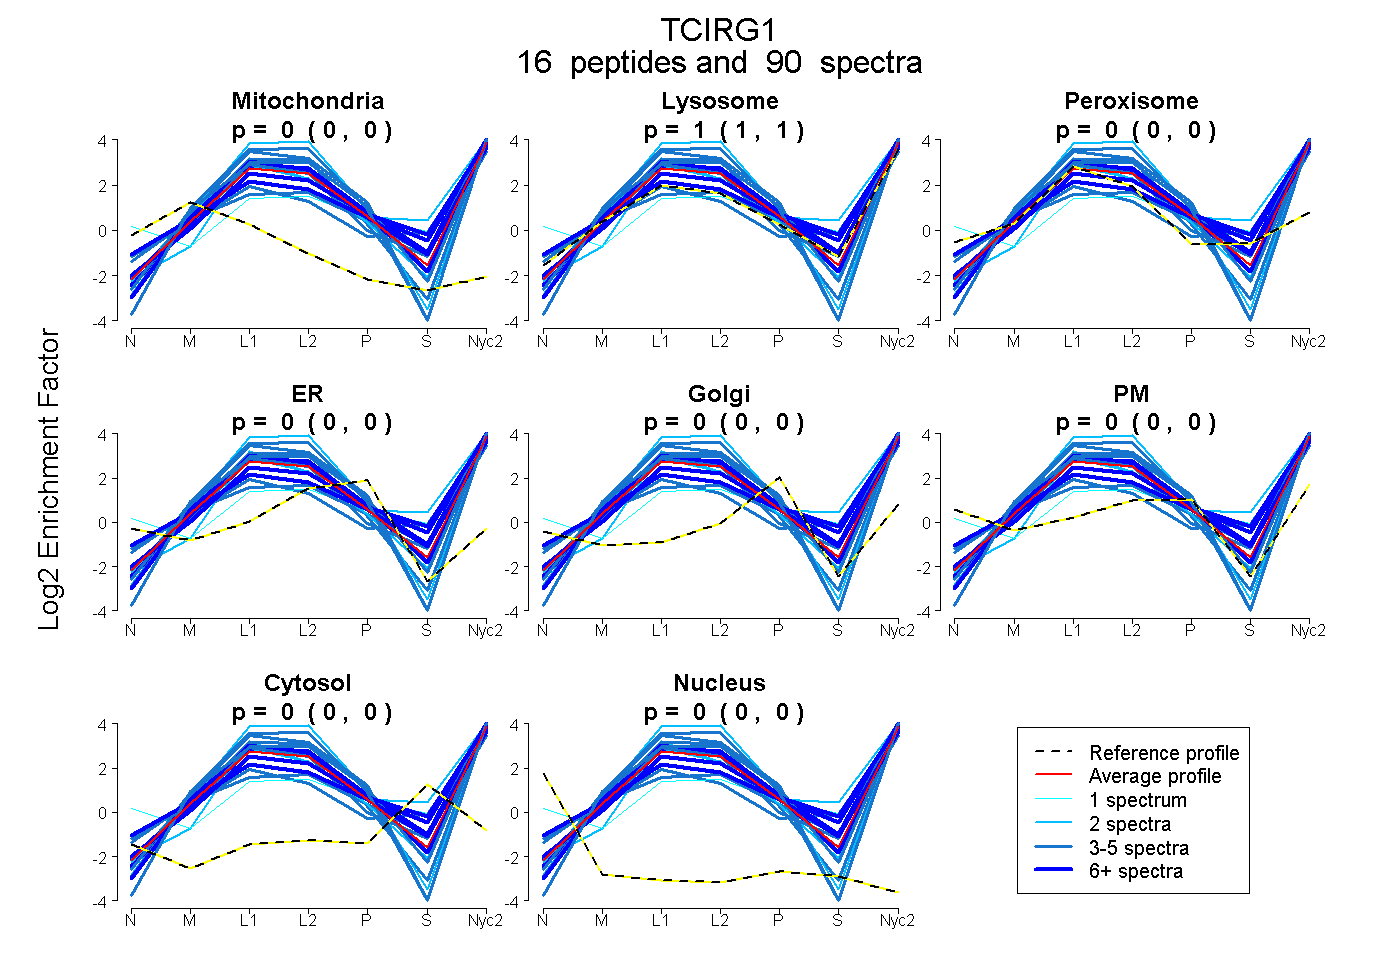
| Expt A |
16 peptides |
90 spectra |
|
0.000 0.000 | 0.000 |
1.000 1.000 | 1.000 |
0.000 0.000 | 0.000 |
0.000 0.000 | 0.000 |
0.000 0.000 | 0.000 |
0.000 0.000 | 0.000 |
0.000 0.000 | 0.000 |
0.000 0.000 | 0.000 |
| 3 spectra, IPCQDMPPTLIR | 0.000 | 1.000 | 0.000 | 0.000 | 0.000 | 0.000 | 0.000 | 0.000 | ||
| 3 spectra, AVYLTLNQCSVNTTHK | 0.000 | 1.000 | 0.000 | 0.000 | 0.000 | 0.000 | 0.000 | 0.000 | ||
| 25 spectra, IGLGMGR | 0.000 | 1.000 | 0.000 | 0.000 | 0.000 | 0.000 | 0.000 | 0.000 | ||
| 5 spectra, FTSSFQGIVDAYGVGR | 0.000 | 0.925 | 0.000 | 0.000 | 0.000 | 0.068 | 0.007 | 0.000 | ||
| 2 spectra, FVVEVR | 0.000 | 1.000 | 0.000 | 0.000 | 0.000 | 0.000 | 0.000 | 0.000 | ||
| 3 spectra, GFLIASFK | 0.000 | 1.000 | 0.000 | 0.000 | 0.000 | 0.000 | 0.000 | 0.000 | ||
| 4 spectra, IQEETDR | 0.000 | 1.000 | 0.000 | 0.000 | 0.000 | 0.000 | 0.000 | 0.000 | ||
| 8 spectra, FLSQVLGR | 0.000 | 1.000 | 0.000 | 0.000 | 0.000 | 0.000 | 0.000 | 0.000 | ||
| 2 spectra, CLIAEVWCATR | 0.000 | 1.000 | 0.000 | 0.000 | 0.000 | 0.000 | 0.000 | 0.000 | ||
| 2 spectra, AAALER | 0.000 | 0.989 | 0.011 | 0.000 | 0.000 | 0.000 | 0.000 | 0.000 | ||
| 4 spectra, DLNESVSAFQR | 0.000 | 0.935 | 0.000 | 0.000 | 0.000 | 0.000 | 0.065 | 0.000 | ||
| 6 spectra, GNQQALR | 0.000 | 1.000 | 0.000 | 0.000 | 0.000 | 0.000 | 0.000 | 0.000 | ||
| 3 spectra, TTQNEIWQTFFGGR | 0.000 | 1.000 | 0.000 | 0.000 | 0.000 | 0.000 | 0.000 | 0.000 | ||
| 12 spectra, TFTFLR | 0.000 | 1.000 | 0.000 | 0.000 | 0.000 | 0.000 | 0.000 | 0.000 | ||
| 1 spectrum, DLPTVQQALQSGSSEEGVSAVAHR | 0.000 | 0.739 | 0.000 | 0.000 | 0.000 | 0.194 | 0.067 | 0.000 | ||
| 7 spectra, LHWVEFQNK | 0.000 | 0.964 | 0.000 | 0.000 | 0.000 | 0.036 | 0.000 | 0.000 |
| Plot | Mito | Lyso or Perox | ER | Golgi | PM | Cytosol | Nucleus | ||||||
| Expt B |
18 peptides |
46 spectra |
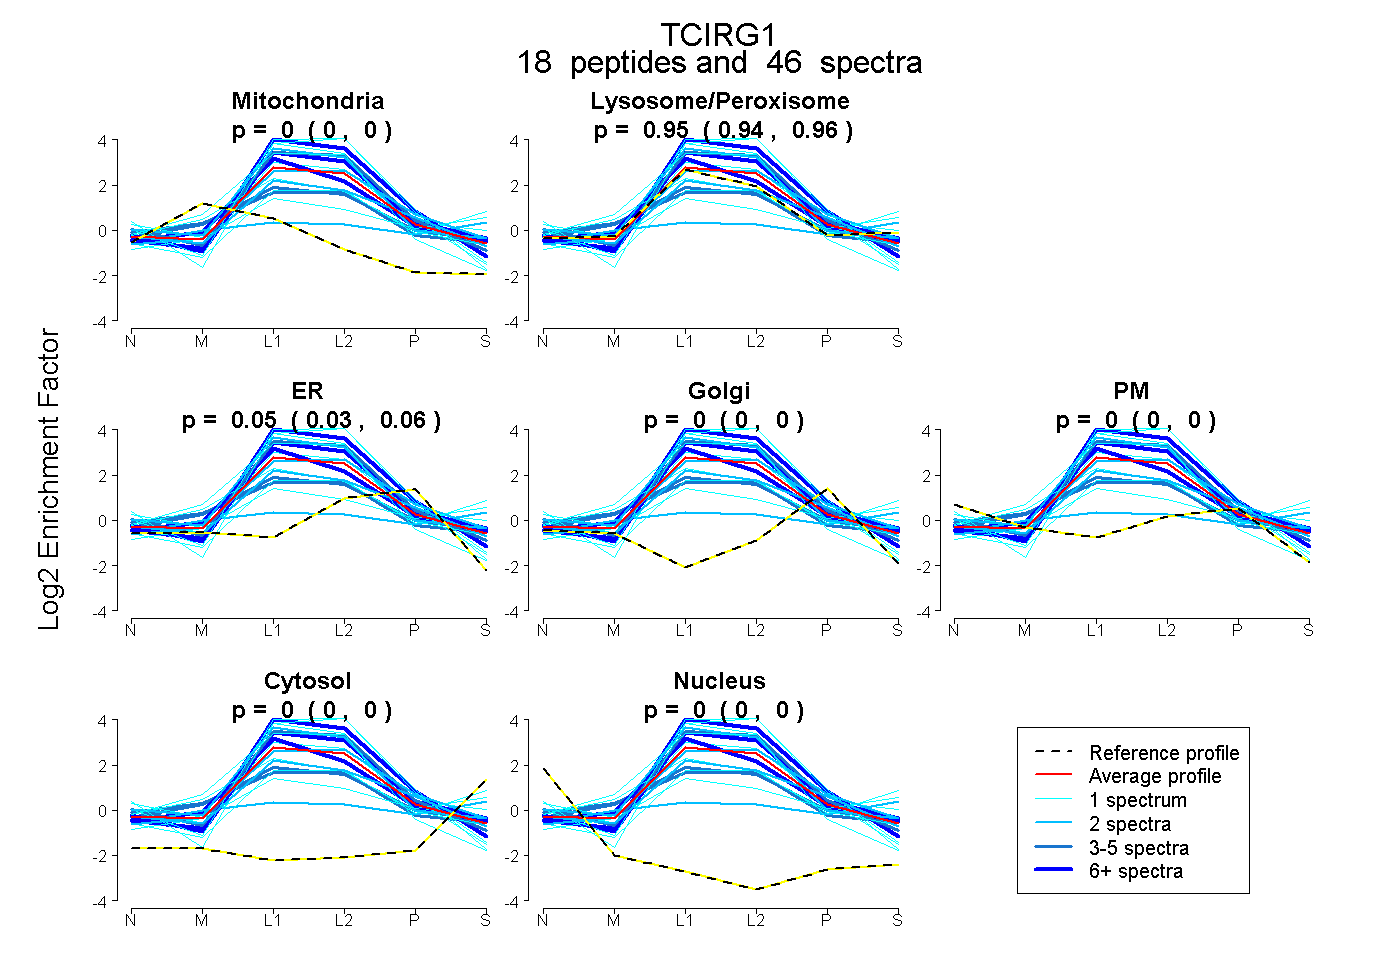 |
0.000 0.000 | 0.000 |
0.952 0.939 | 0.965 |
0.048 0.033 | 0.059 |
0.000 0.000 | 0.000 |
0.000 0.000 | 0.000 |
0.000 0.000 | 0.000 |
0.000 0.000 | 0.000 |
|||
| Plot | Lyso | Other | |||||||||||
| Expt C |
24 peptides |
374 spectra |
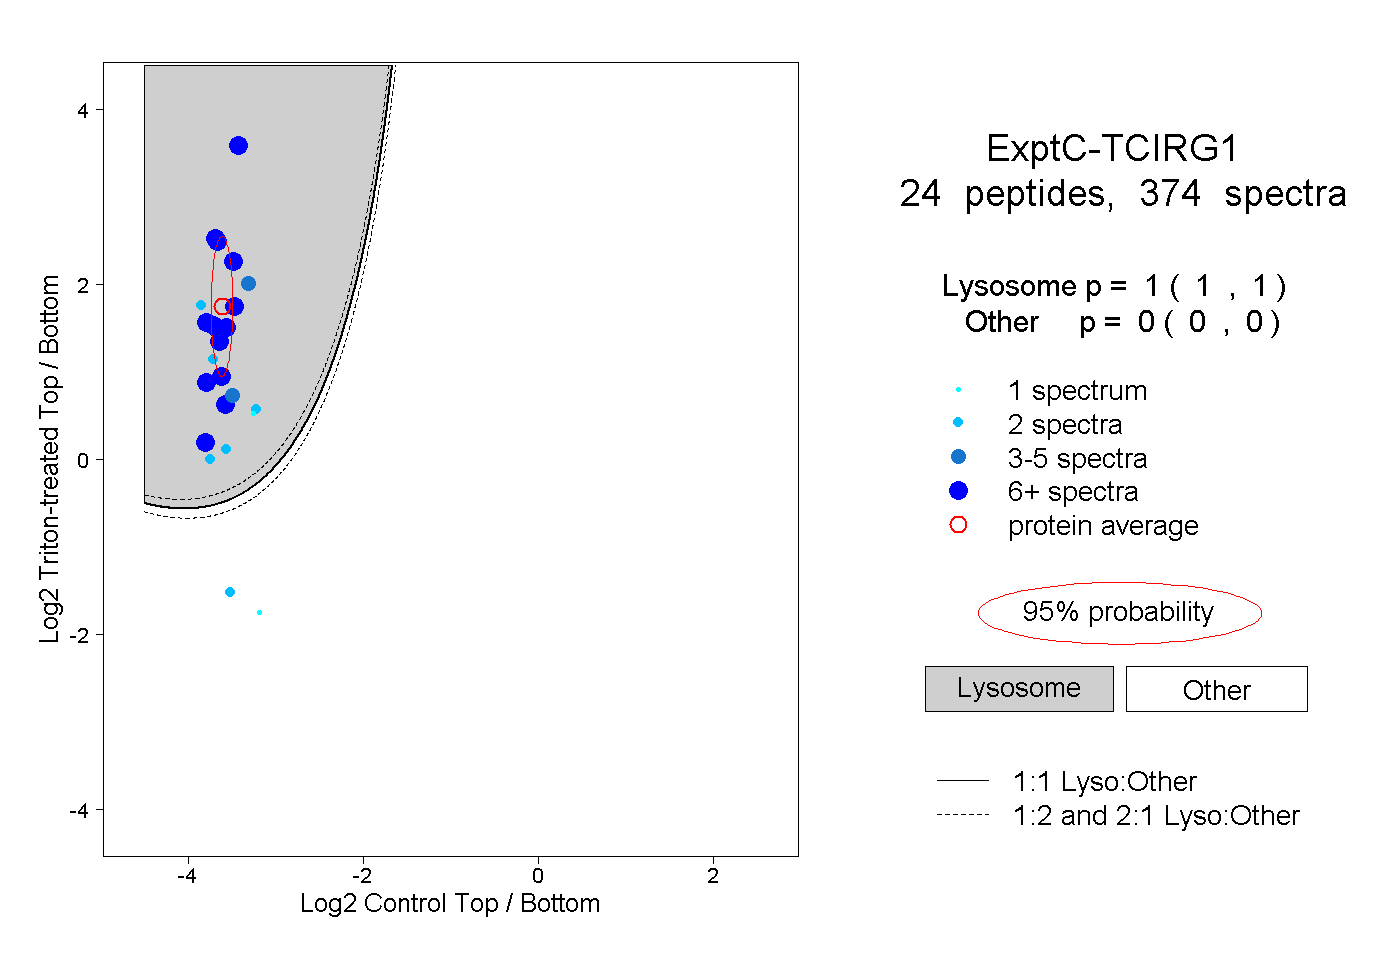 |
1.000 1.000 | 1.000 |
0.000 0.000 | 0.000 |
||||||||
| Plot | Lyso | Other | |||||||||||
| Expt D |
13 peptides |
34 spectra |
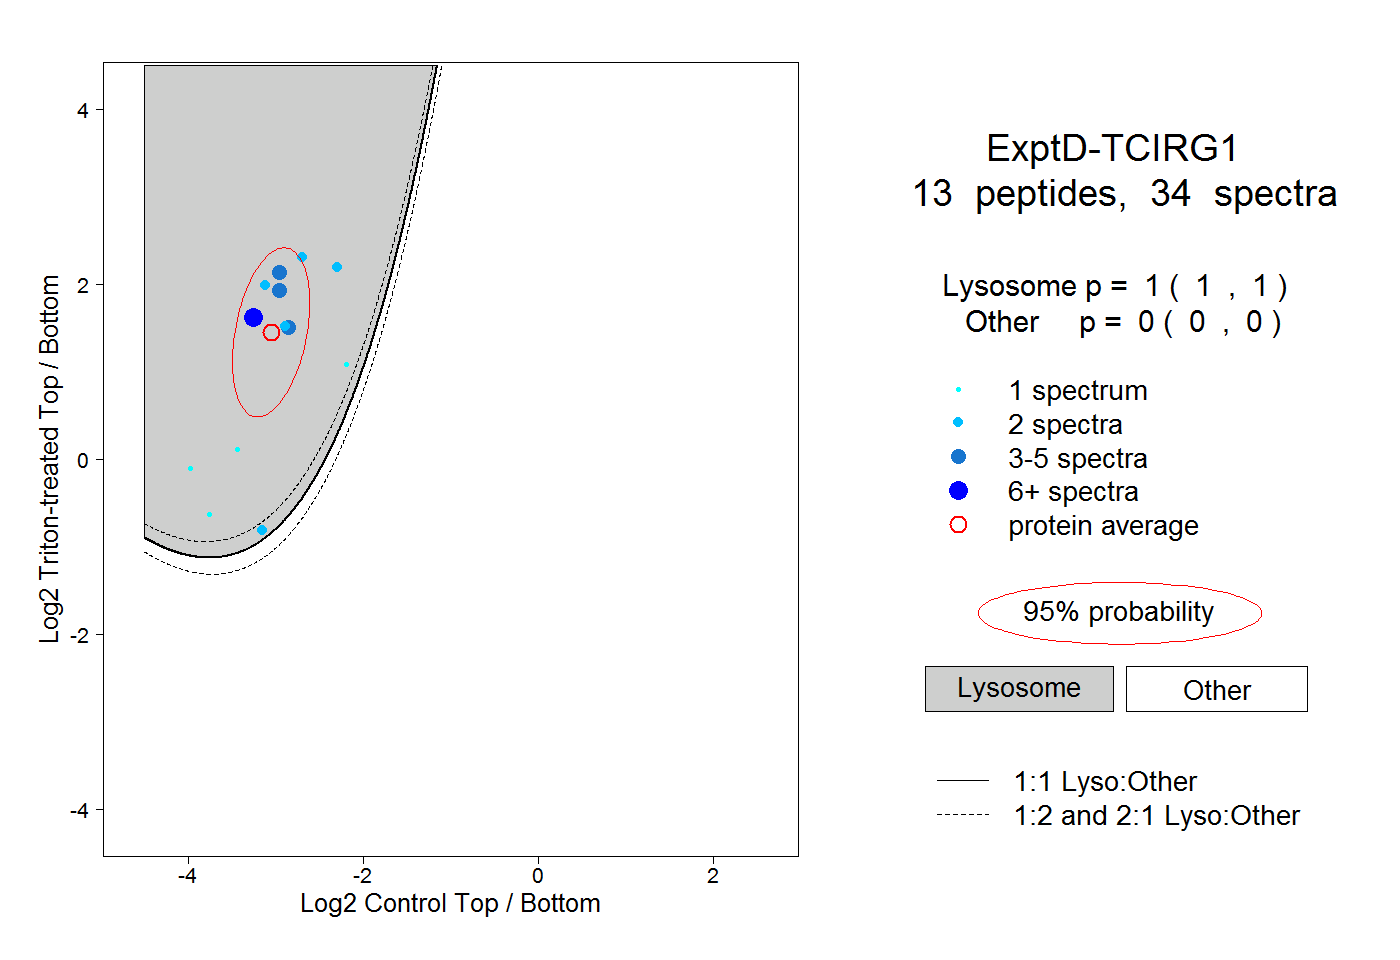 |
1.000 1.000 | 1.000 |
0.000 0.000 | 0.000 |