 9
9peptides
spectra
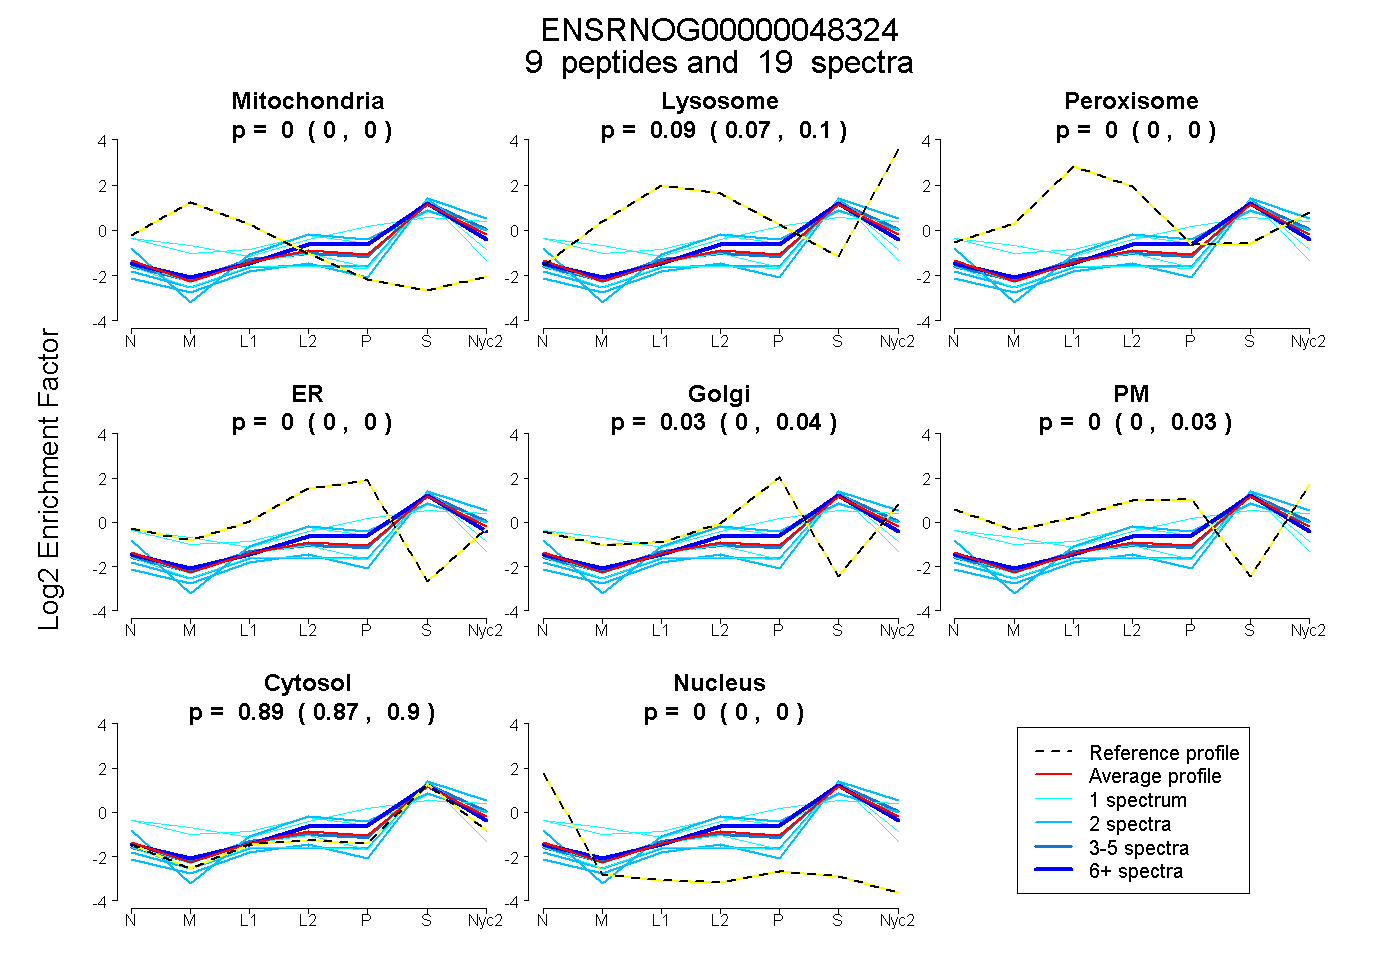
0.000 | 0.000
0.068 | 0.096
0.000 | 0.000
0.000 | 0.000
0.000 | 0.043
0.000 | 0.029
0.874 | 0.898
0.000 | 0.000
4peptides
spectra
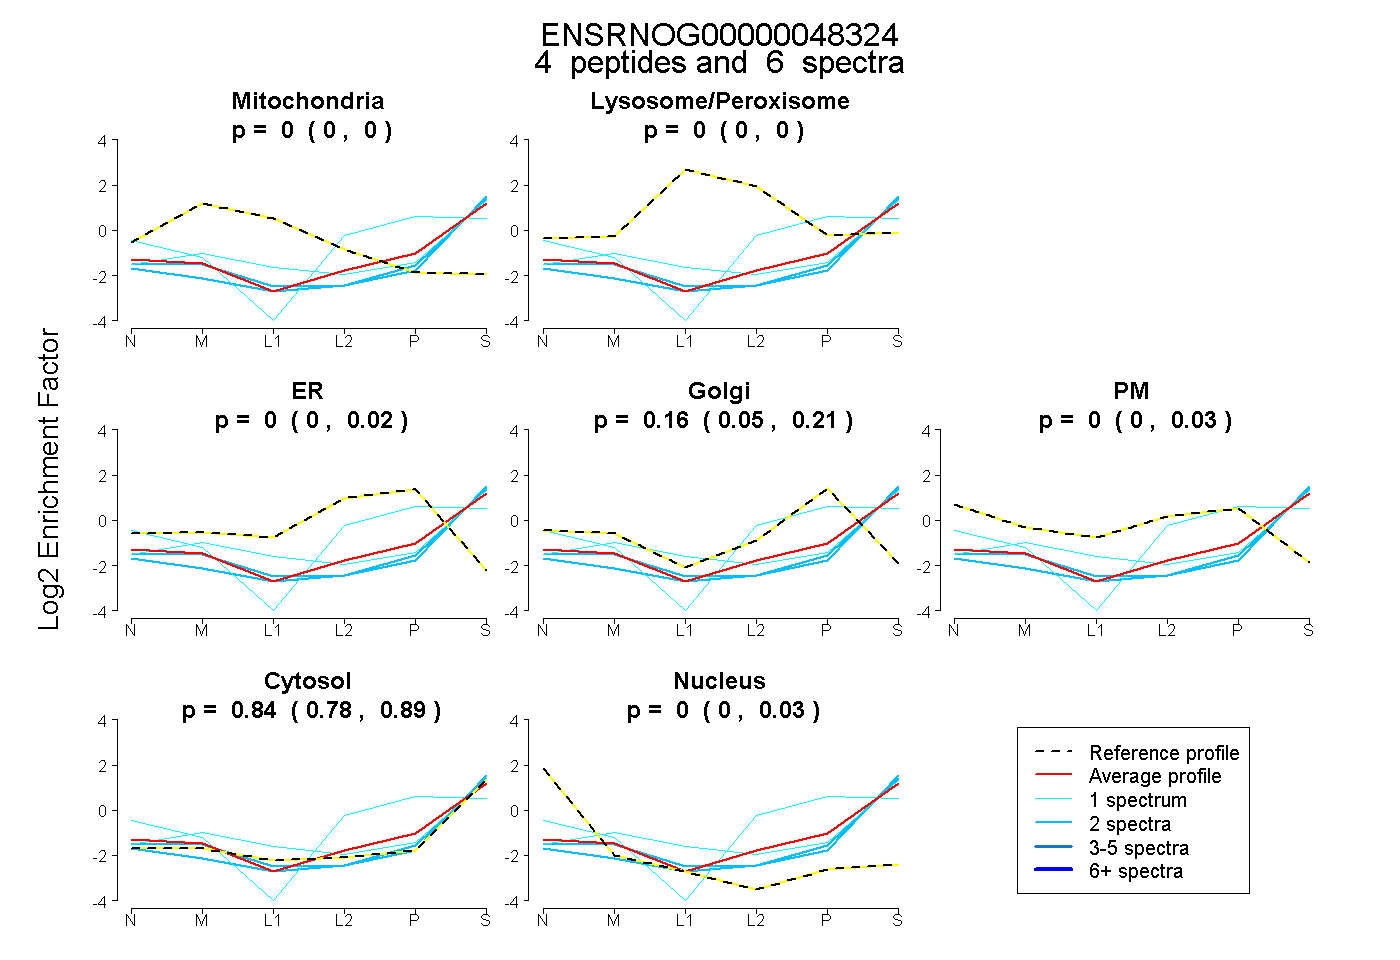
0.000 | 0.000
0.000 | 0.000
0.000 | 0.022
0.047 | 0.207
0.000 | 0.035
0.779 | 0.891
0.000 | 0.031
7peptides
spectra
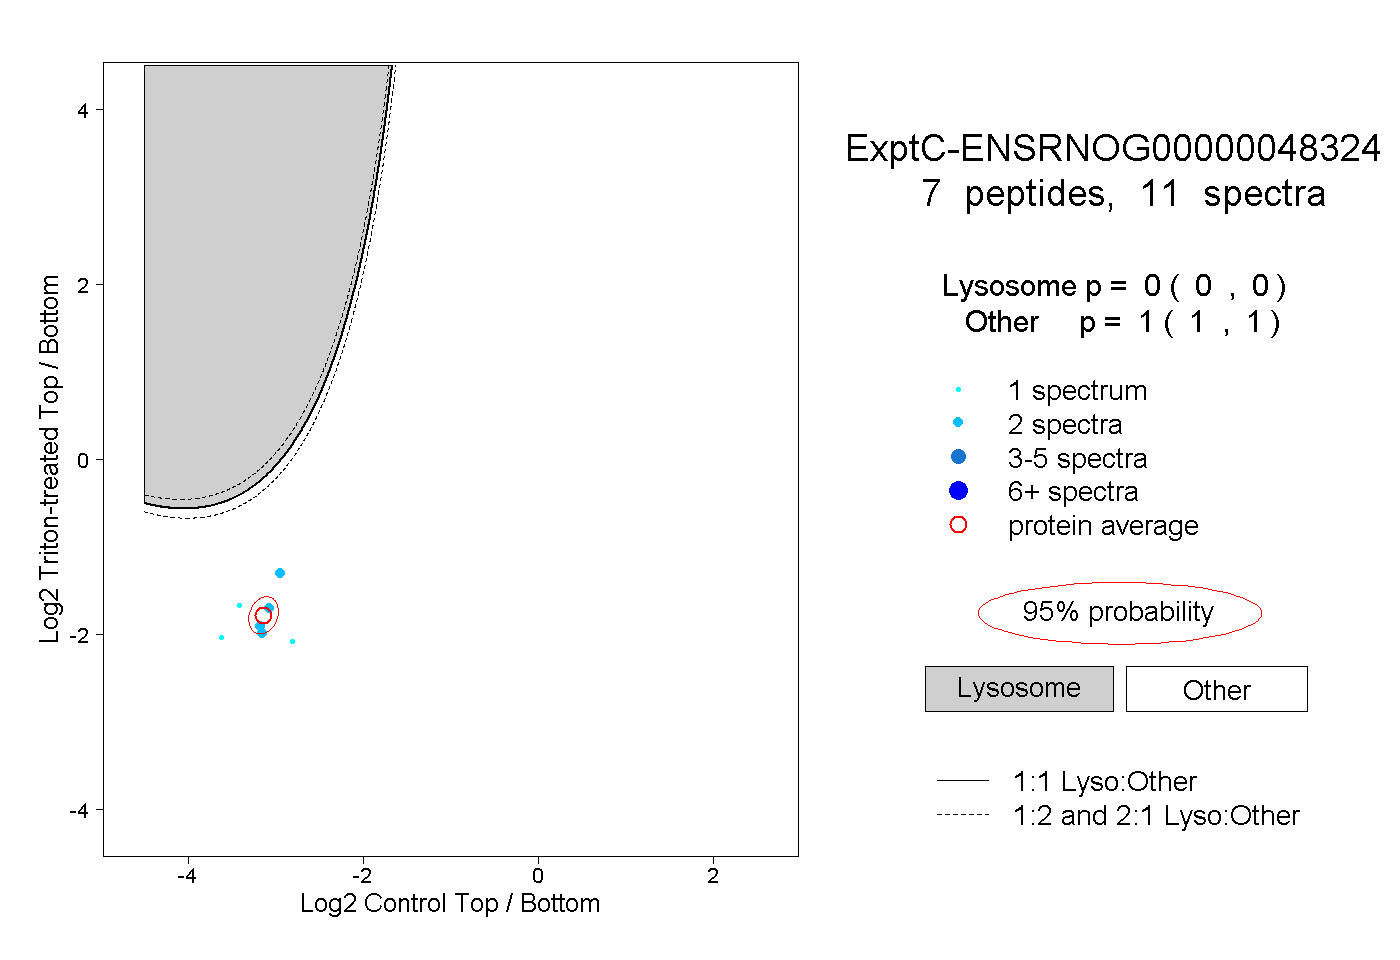
0.000 | 0.000
1.000 | 1.000