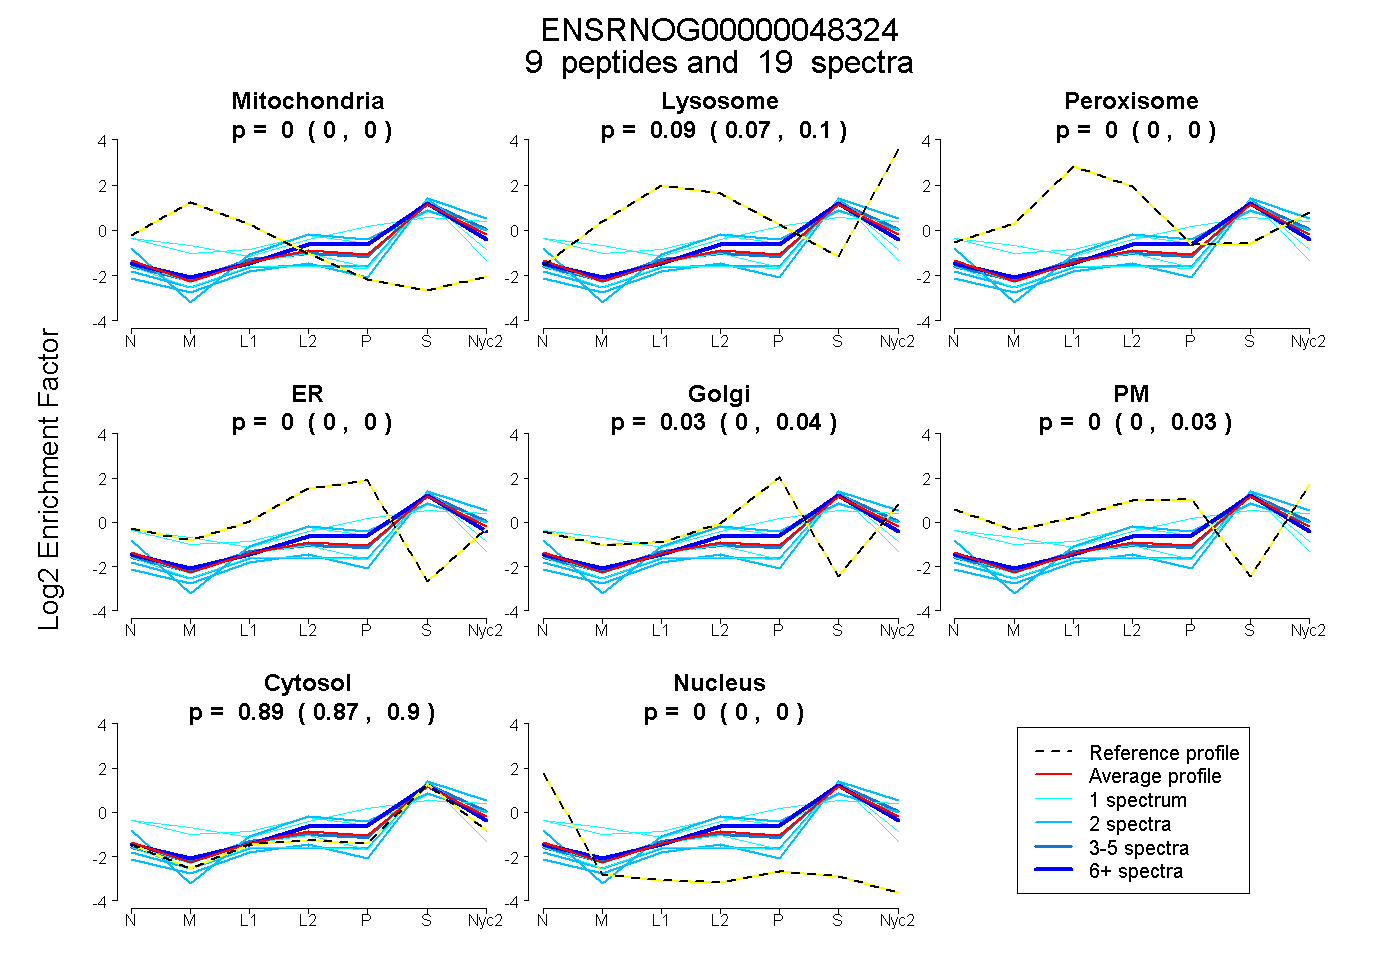
 9
9peptides
spectra
0.000 | 0.000
0.068 | 0.096
0.000 | 0.000
0.000 | 0.000
0.000 | 0.043
0.000 | 0.029
0.874 | 0.898
0.000 | 0.000
| Plot | Mito | Lyso | Perox | ER | Golgi | PM | Cytosol | Nucleus | |||||
| Expt A |
9 peptides |
19 spectra |
|
0.000 0.000 | 0.000 |
0.086 0.068 | 0.096 |
0.000 0.000 | 0.000 |
0.000 0.000 | 0.000 |
0.027 0.000 | 0.043 |
0.000 0.000 | 0.029 |
0.887 0.874 | 0.898 |
0.000 0.000 | 0.000 |
| 1 spectrum, LQATVETDDHIR | 0.000 | 0.000 | 0.134 | 0.000 | 0.000 | 0.231 | 0.634 | 0.000 | ||
| 6 spectra, TSEEFVR | 0.000 | 0.062 | 0.000 | 0.034 | 0.057 | 0.000 | 0.847 | 0.000 | ||
| 1 spectrum, FESWEDDQVPK | 0.000 | 0.057 | 0.000 | 0.000 | 0.074 | 0.308 | 0.561 | 0.000 | ||
| 3 spectra, AAFFAER | 0.000 | 0.112 | 0.000 | 0.000 | 0.000 | 0.000 | 0.888 | 0.000 | ||
| 2 spectra, SSGIGDNPGSETTTPR | 0.000 | 0.006 | 0.000 | 0.072 | 0.000 | 0.137 | 0.785 | 0.000 | ||
| 2 spectra, LFAVNK | 0.000 | 0.036 | 0.000 | 0.000 | 0.000 | 0.000 | 0.964 | 0.000 | ||
| 2 spectra, EAVEAQIR | 0.000 | 0.000 | 0.000 | 0.000 | 0.000 | 0.000 | 1.000 | 0.000 | ||
| 1 spectrum, QLFAYPGCDAGIR | 0.000 | 0.000 | 0.000 | 0.000 | 0.000 | 0.000 | 0.960 | 0.040 | ||
| 1 spectrum, QQGPEAVR | 0.016 | 0.000 | 0.021 | 0.000 | 0.000 | 0.000 | 0.963 | 0.000 |
| Plot | Mito | Lyso or Perox | ER | Golgi | PM | Cytosol | Nucleus | ||||||
| Expt B |
4 peptides |
6 spectra |
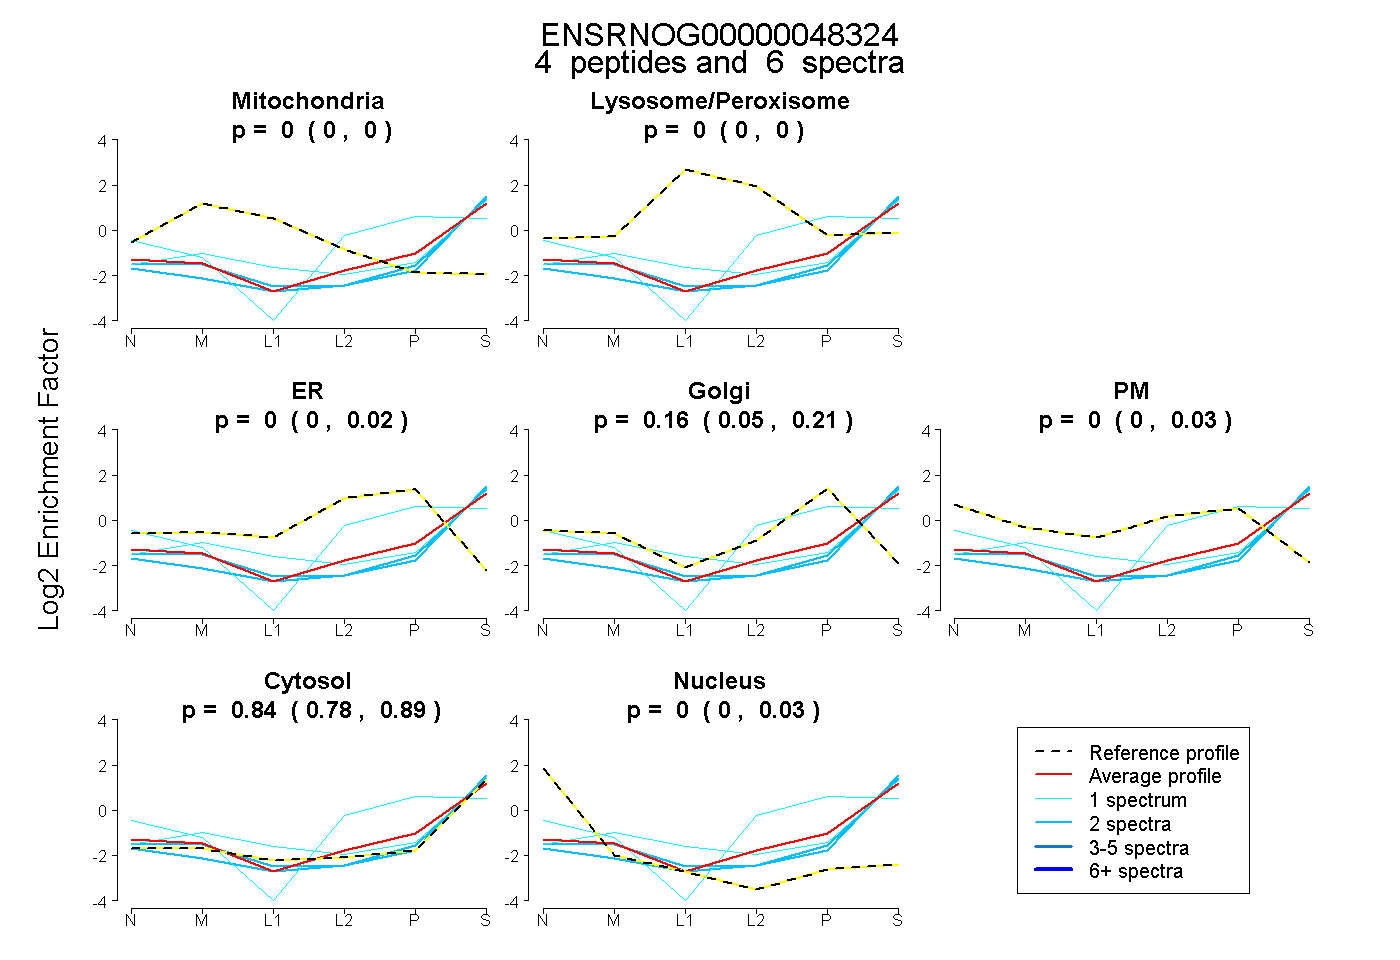 |
0.000 0.000 | 0.000 |
0.000 0.000 | 0.000 |
0.000 0.000 | 0.022 |
0.158 0.047 | 0.207 |
0.000 0.000 | 0.035 |
0.842 0.779 | 0.891 |
0.000 0.000 | 0.031 |
|||
| Plot | Lyso | Other | |||||||||||
| Expt C |
7 peptides |
11 spectra |
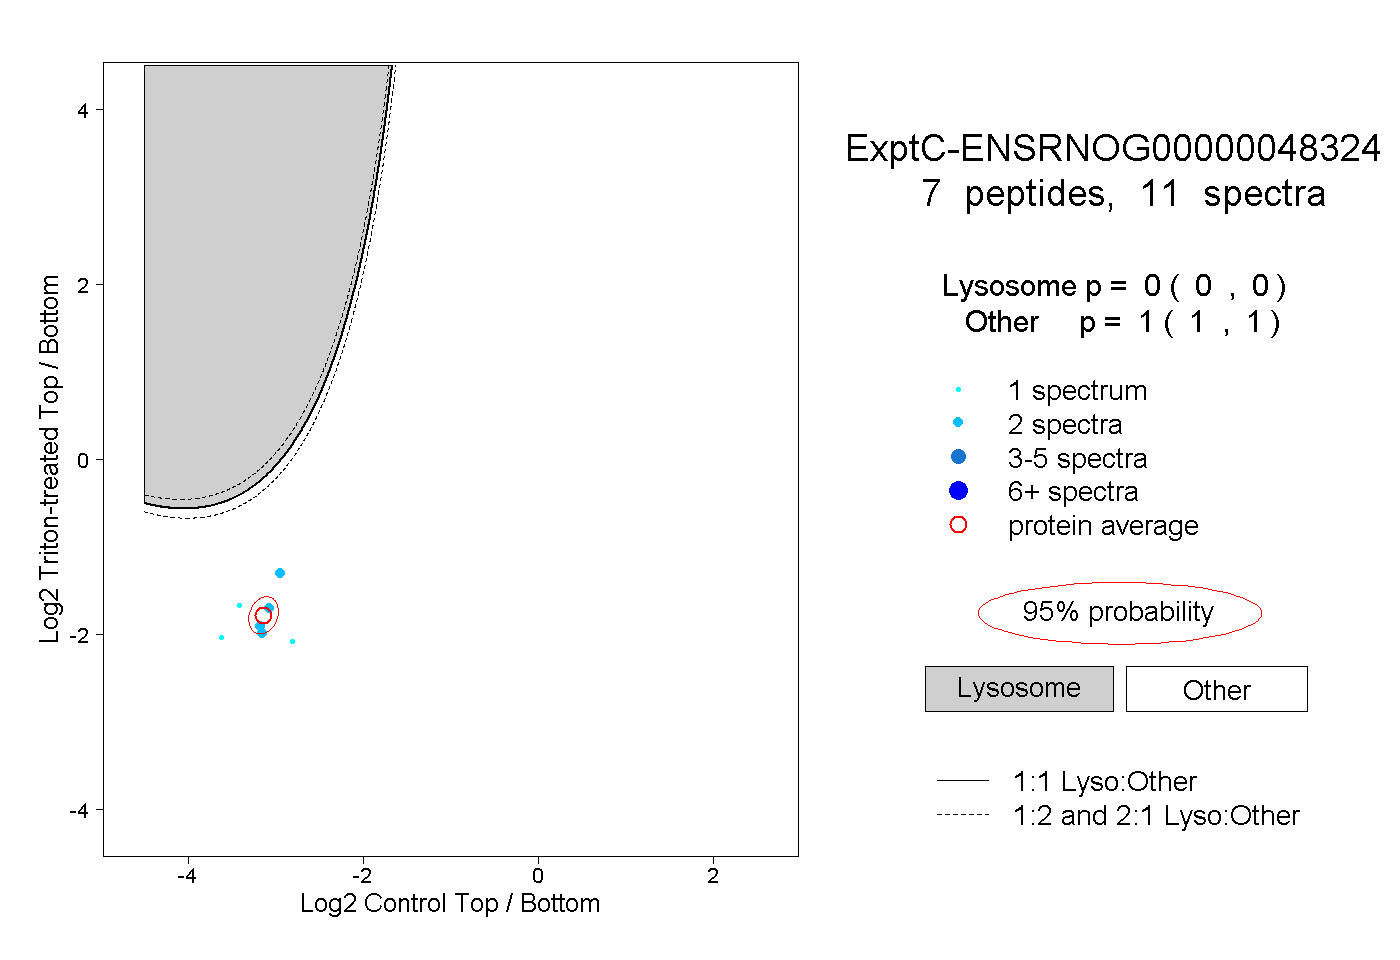 |
0.000 0.000 | 0.000 |
1.000 1.000 | 1.000 |