 33
33peptides
spectra
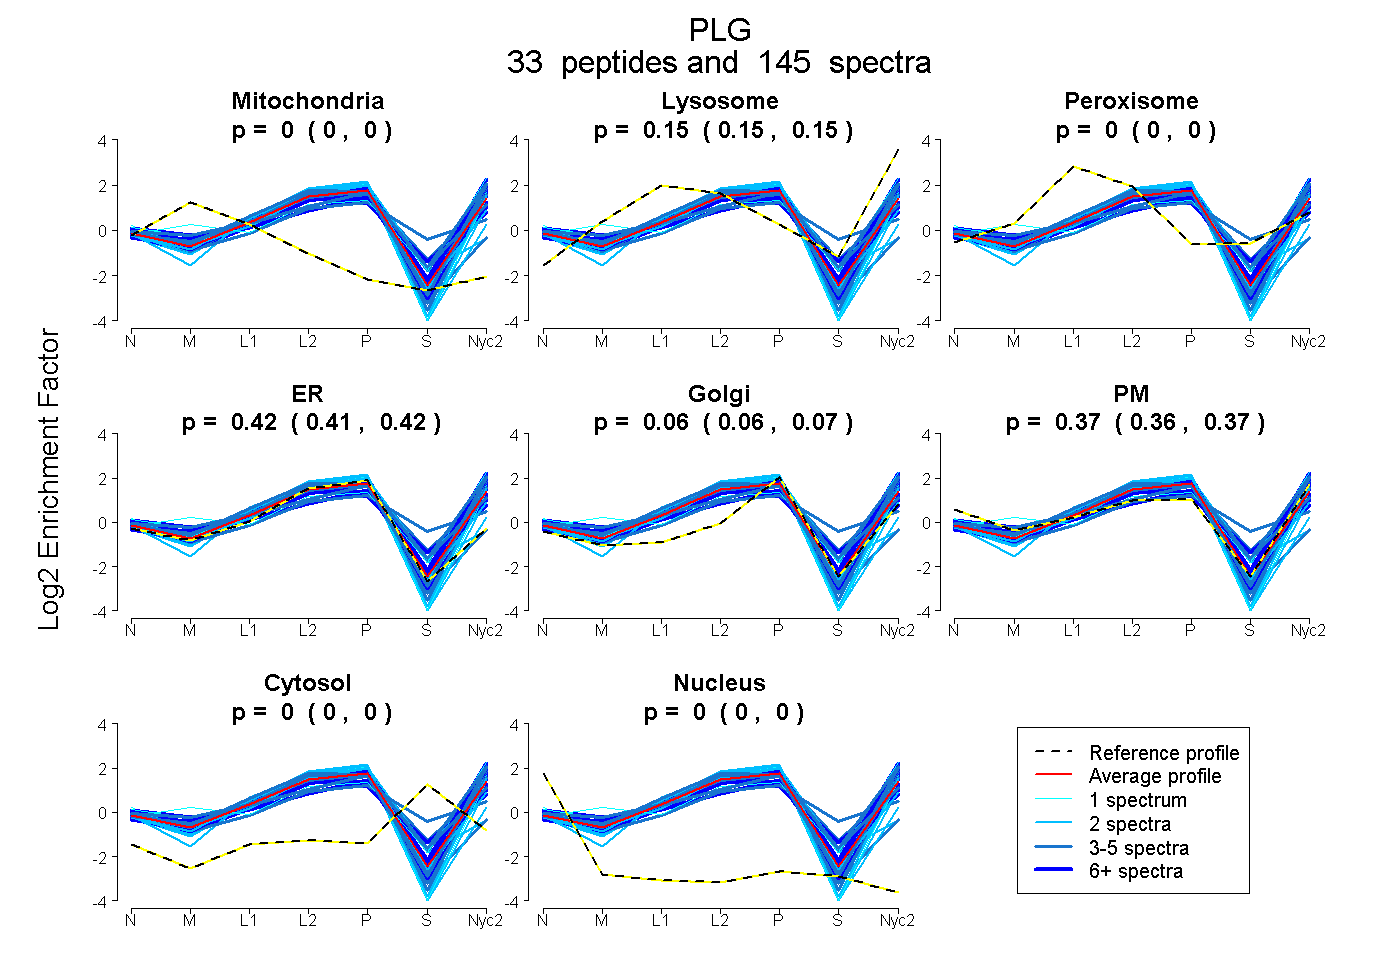
0.000 | 0.000
0.147 | 0.152
0.000 | 0.000
0.411 | 0.424
0.060 | 0.067
0.363 | 0.373
0.000 | 0.000
0.000 | 0.000
20peptides
spectra
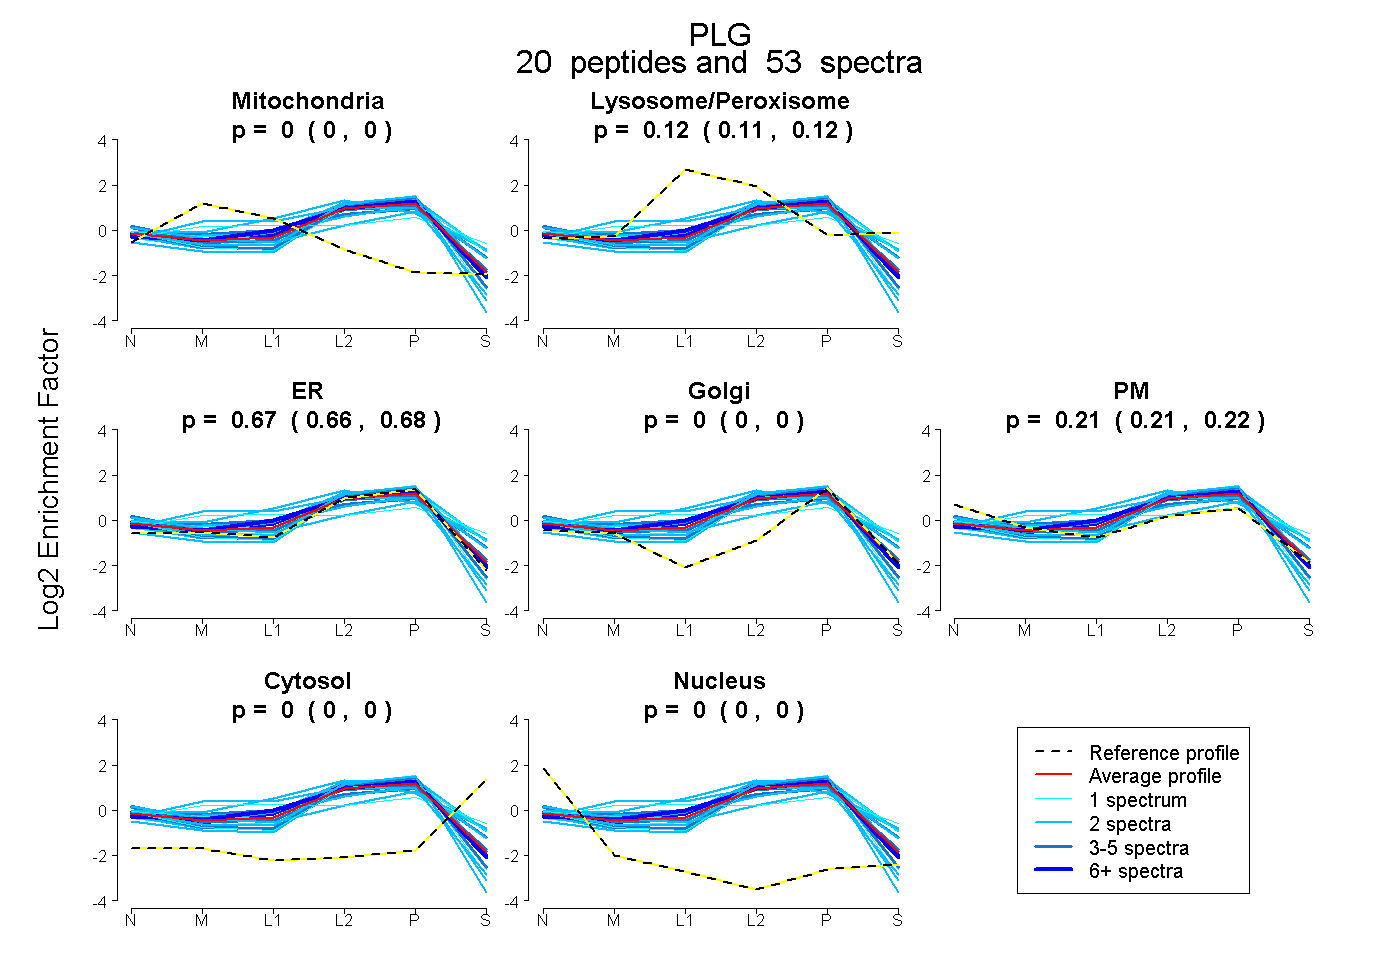
0.000 | 0.000
0.111 | 0.124
0.659 | 0.677
0.000 | 0.000
0.205 | 0.220
0.000 | 0.000
0.000 | 0.000
30peptides
spectra
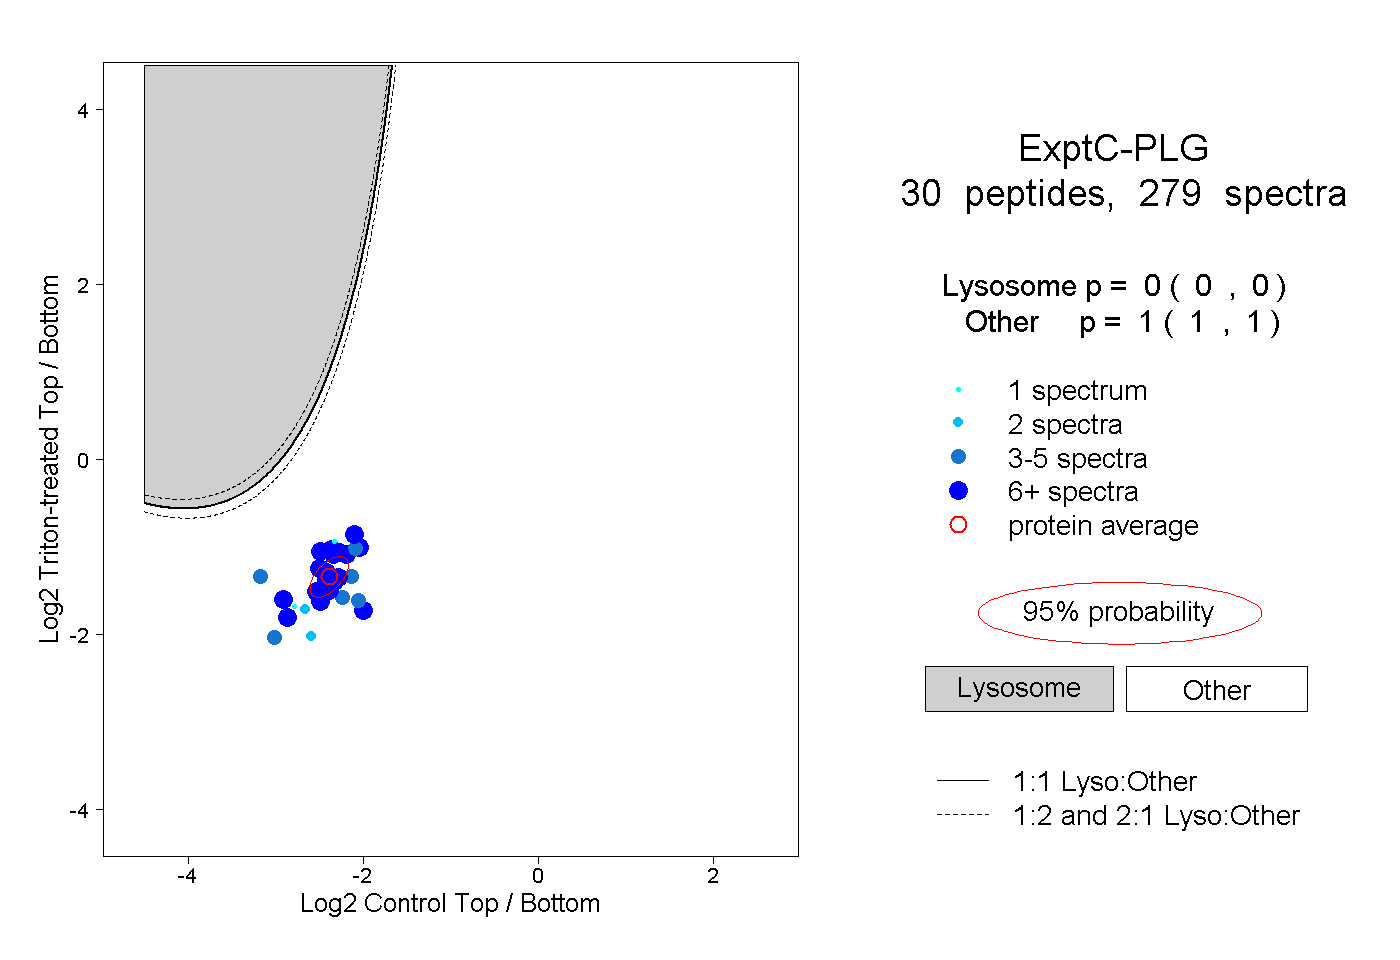
0.000 | 0.000
1.000 | 1.000
17peptides
spectra
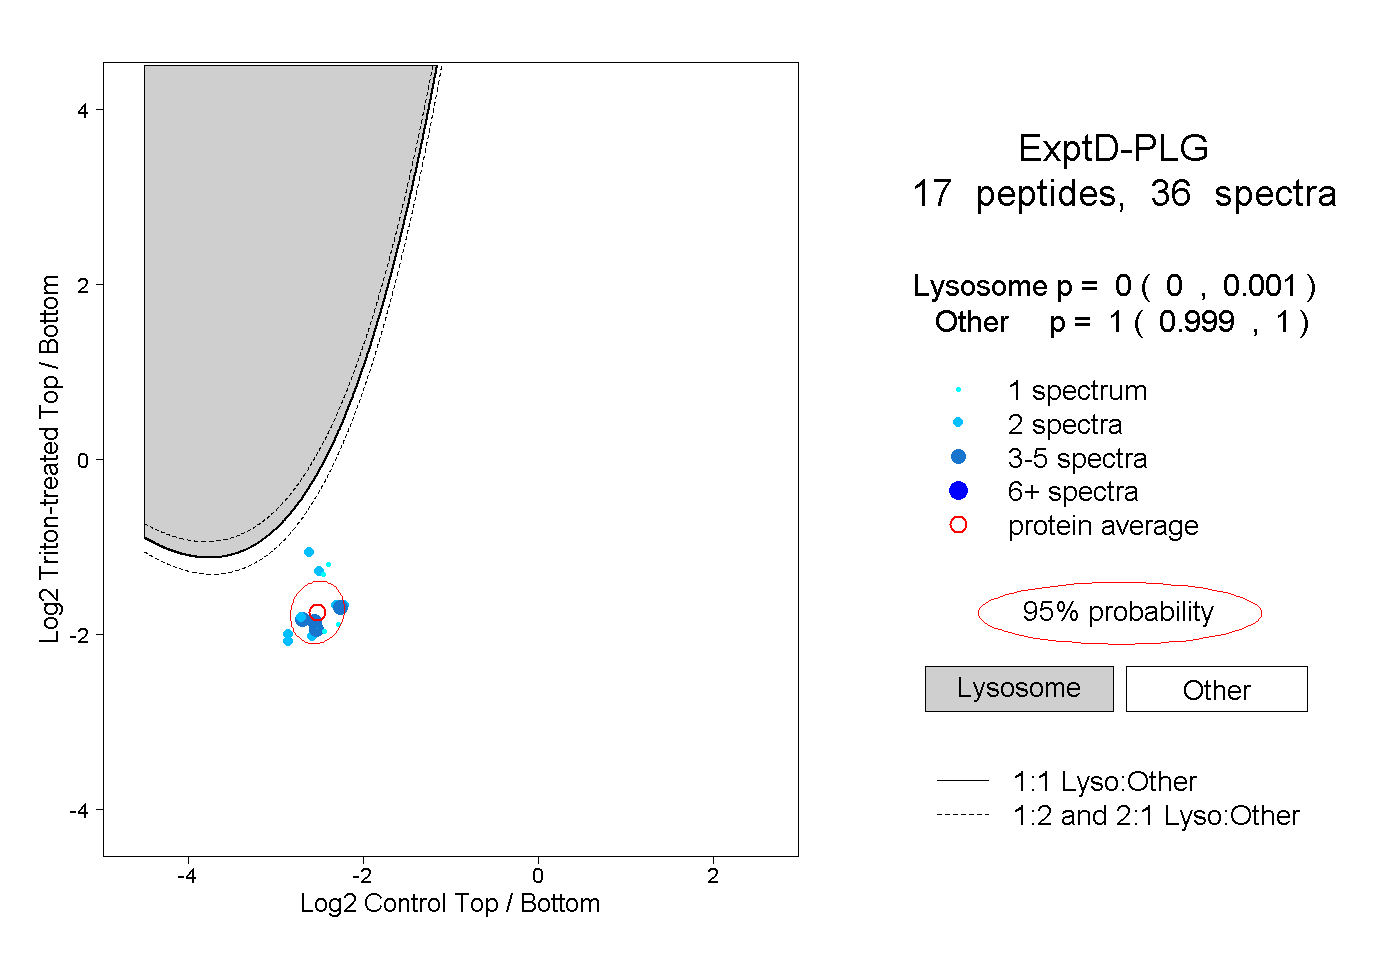
0.000 | 0.001
0.999 | 1.000