 13
13peptides
spectra
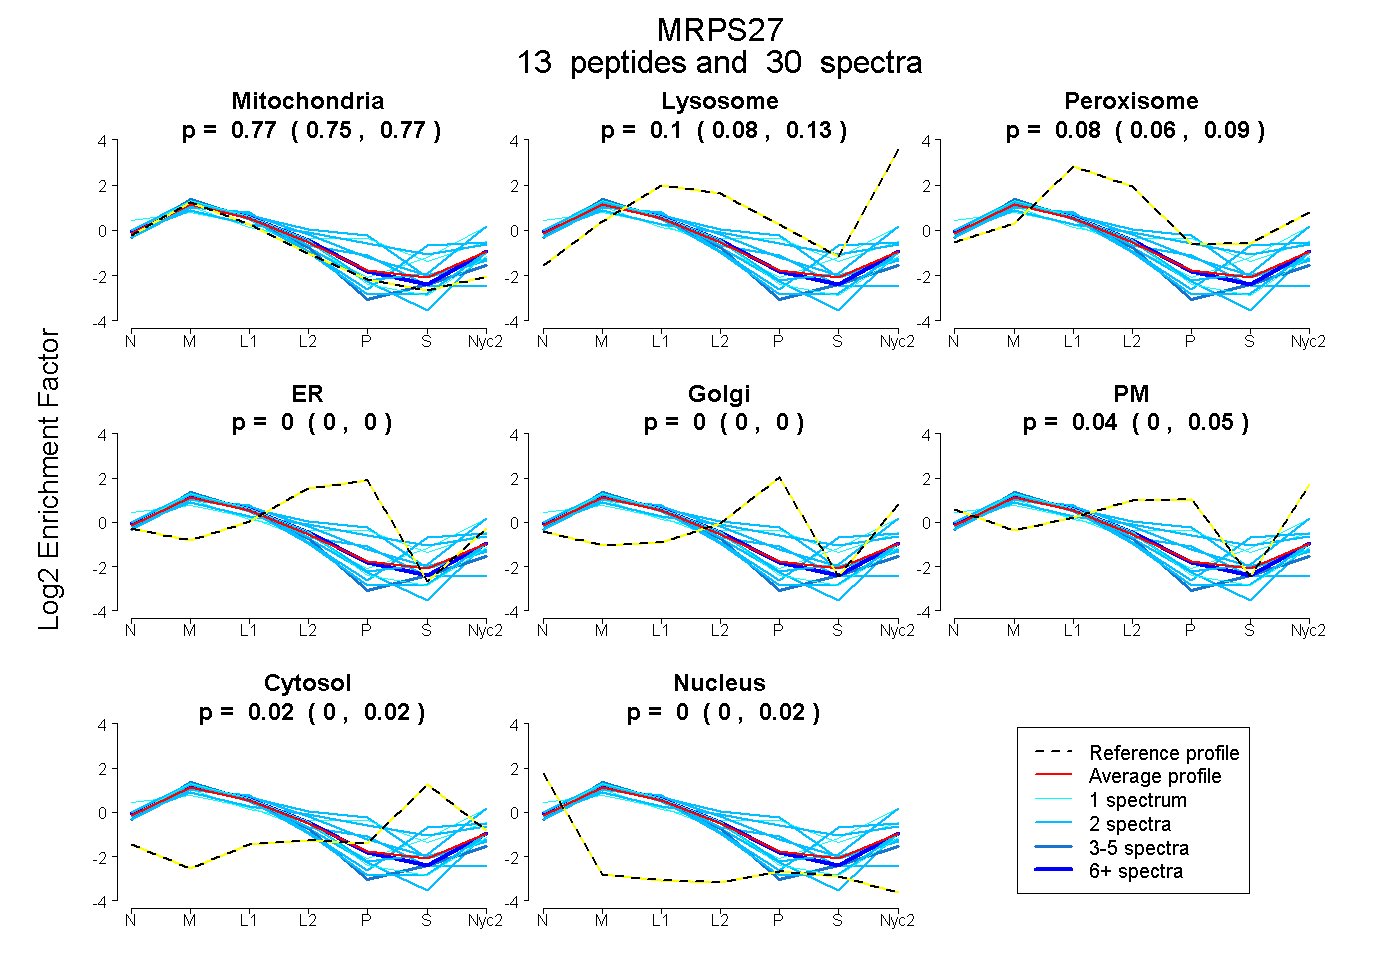
0.753 | 0.774
0.081 | 0.131
0.059 | 0.092
0.000 | 0.000
0.000 | 0.000
0.001 | 0.055
0.000 | 0.024
0.000 | 0.017
3peptides
spectra
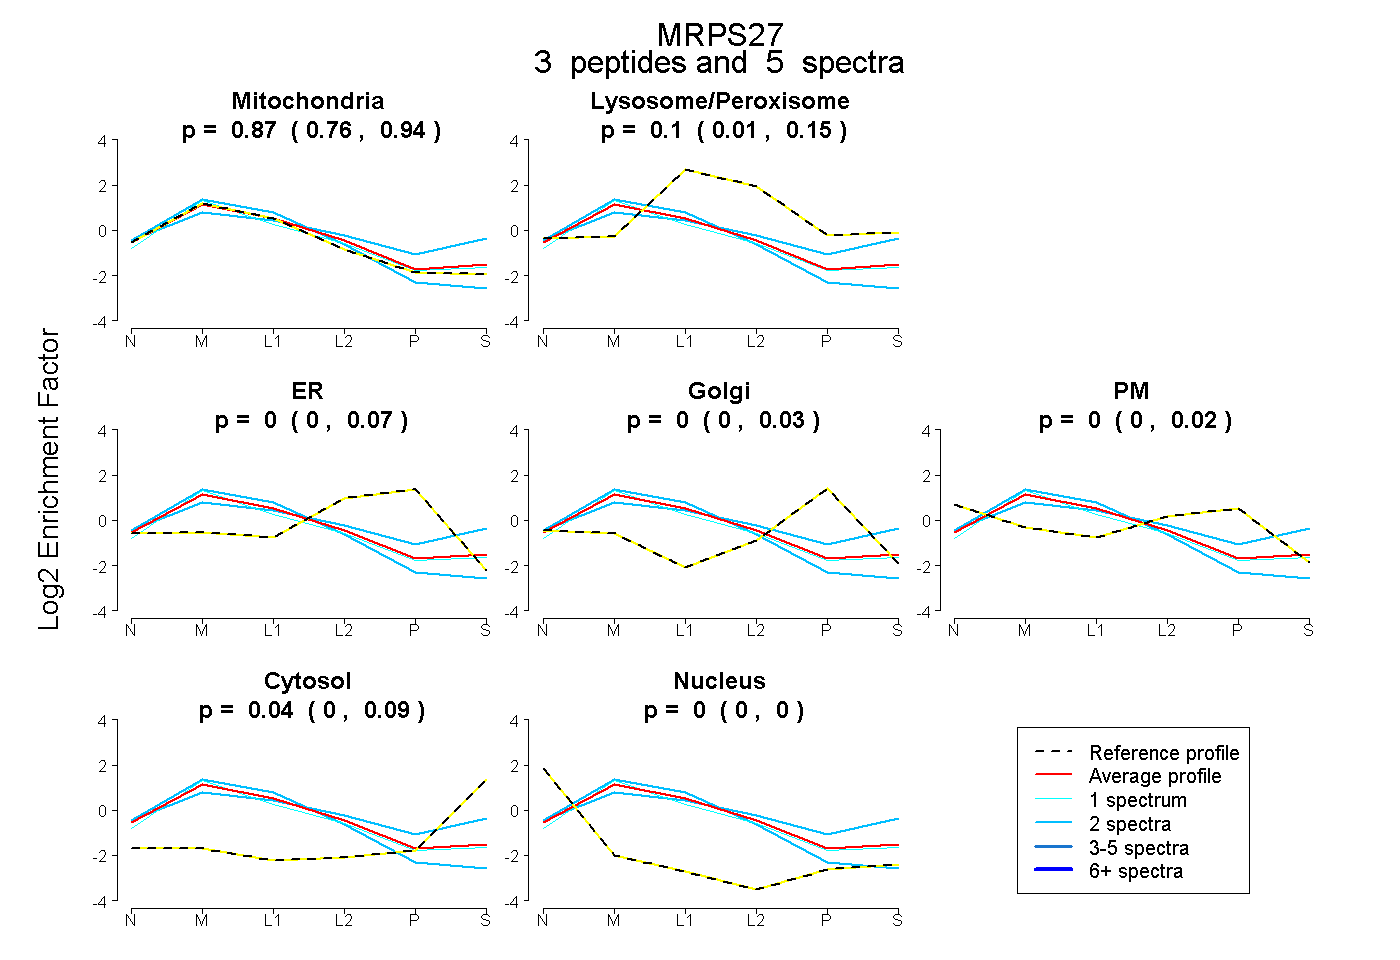
0.759 | 0.940
0.013 | 0.145
0.000 | 0.068
0.000 | 0.030
0.000 | 0.018
0.000 | 0.087
0.000 | 0.000
21peptides
spectra
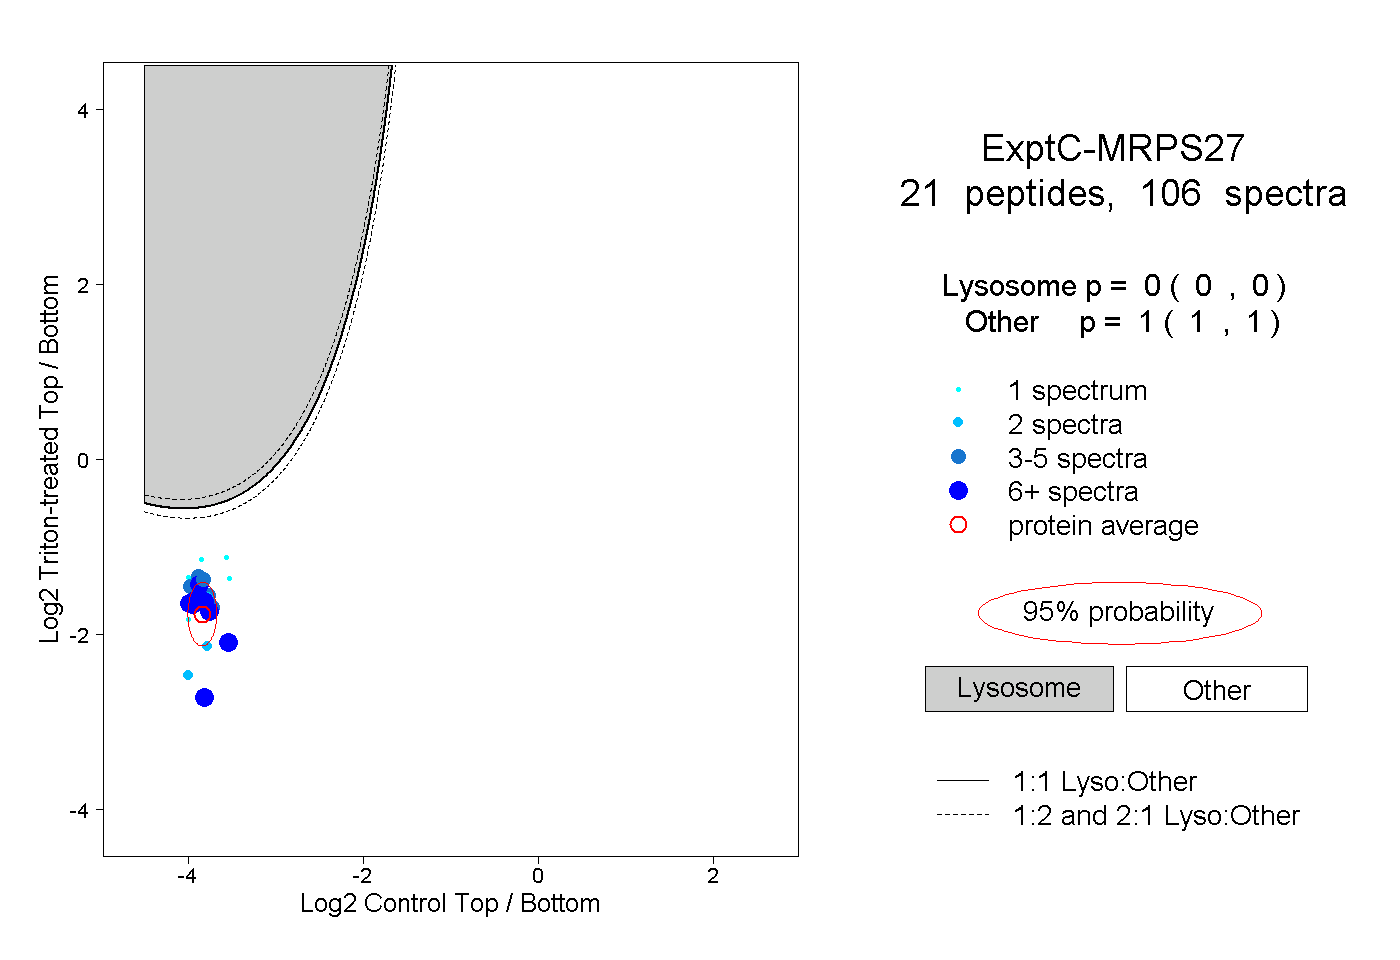
0.000 | 0.000
1.000 | 1.000
3peptides
spectra
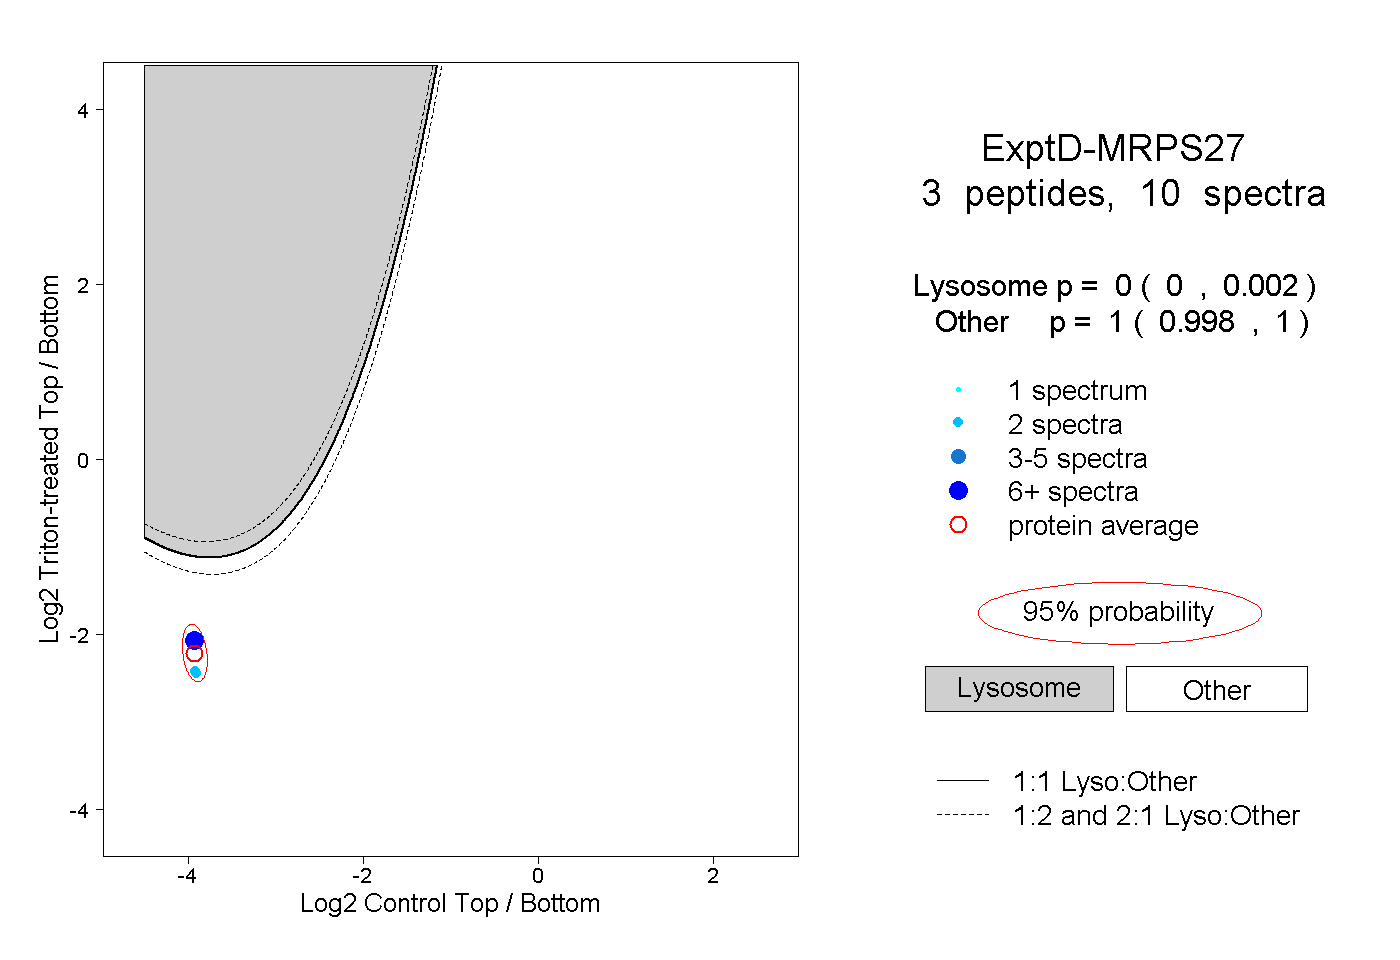
0.000 | 0.002
0.998 | 1.000