 13
13peptides
spectra
0.753 | 0.774
0.081 | 0.131
0.059 | 0.092
0.000 | 0.000
0.000 | 0.000
0.001 | 0.055
0.000 | 0.024
0.000 | 0.017
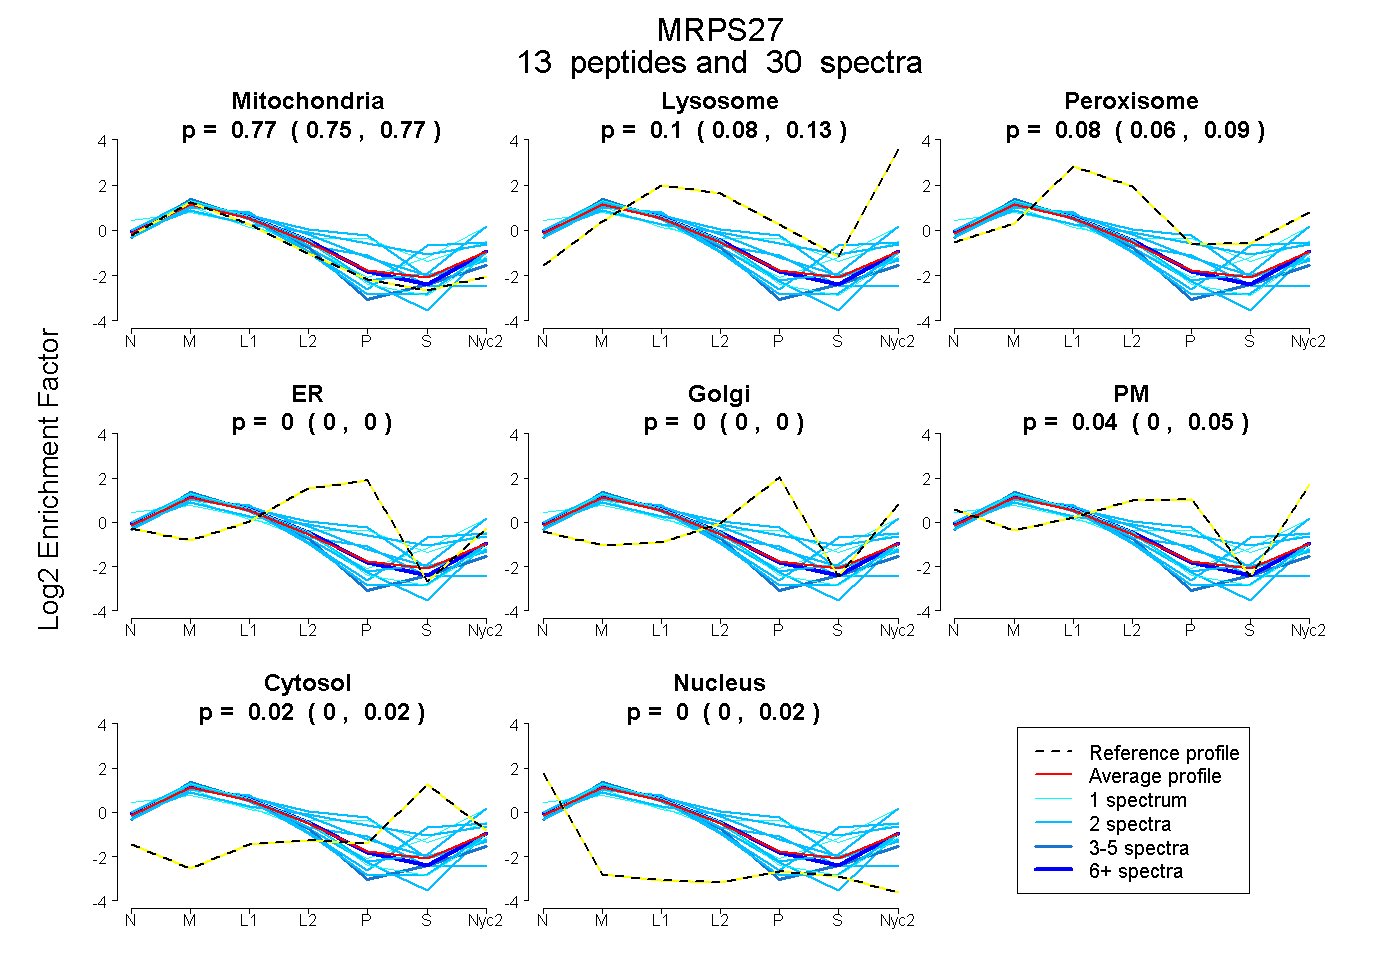
| Plot | Mito | Lyso | Perox | ER | Golgi | PM | Cytosol | Nucleus | |||||
| Expt A |
13 peptides |
30 spectra |
|
0.767 0.753 | 0.774 |
0.101 0.081 | 0.131 |
0.076 0.059 | 0.092 |
0.000 0.000 | 0.000 |
0.000 0.000 | 0.000 |
0.038 0.001 | 0.055 |
0.017 0.000 | 0.024 |
0.000 0.000 | 0.017 |
| 1 spectrum, VESESLLTLTTQLVK | 0.877 | 0.105 | 0.019 | 0.000 | 0.000 | 0.000 | 0.000 | 0.000 | ||
| 2 spectra, ALQVMER | 0.555 | 0.000 | 0.140 | 0.305 | 0.000 | 0.000 | 0.000 | 0.000 | ||
| 2 spectra, DFGASLLLPGLK | 0.864 | 0.046 | 0.000 | 0.000 | 0.000 | 0.090 | 0.000 | 0.000 | ||
| 2 spectra, EVLDVLDGVLK | 0.670 | 0.000 | 0.218 | 0.071 | 0.030 | 0.011 | 0.000 | 0.000 | ||
| 4 spectra, DWTIHTWIR | 0.937 | 0.000 | 0.063 | 0.000 | 0.000 | 0.000 | 0.000 | 0.000 | ||
| 2 spectra, TDLTWEEER | 0.913 | 0.087 | 0.000 | 0.000 | 0.000 | 0.000 | 0.000 | 0.000 | ||
| 2 spectra, EWHQER | 0.439 | 0.000 | 0.251 | 0.000 | 0.137 | 0.059 | 0.113 | 0.000 | ||
| 7 spectra, MQLVQR | 0.784 | 0.094 | 0.056 | 0.000 | 0.000 | 0.066 | 0.000 | 0.000 | ||
| 2 spectra, LPVSSLSISR | 0.589 | 0.035 | 0.200 | 0.000 | 0.000 | 0.000 | 0.176 | 0.000 | ||
| 2 spectra, EDIDSAEYYLYK | 0.848 | 0.000 | 0.000 | 0.152 | 0.000 | 0.000 | 0.000 | 0.000 | ||
| 1 spectrum, ALYTLVNK | 0.498 | 0.287 | 0.029 | 0.000 | 0.000 | 0.000 | 0.080 | 0.106 | ||
| 2 spectra, VELQCGLR | 0.685 | 0.298 | 0.000 | 0.000 | 0.000 | 0.000 | 0.000 | 0.017 | ||
| 1 spectrum, AVYHGMPLIWTPGYLDR | 0.499 | 0.109 | 0.102 | 0.000 | 0.225 | 0.000 | 0.065 | 0.000 |
| Plot | Mito | Lyso or Perox | ER | Golgi | PM | Cytosol | Nucleus | ||||||
| Expt B |
3 peptides |
5 spectra |
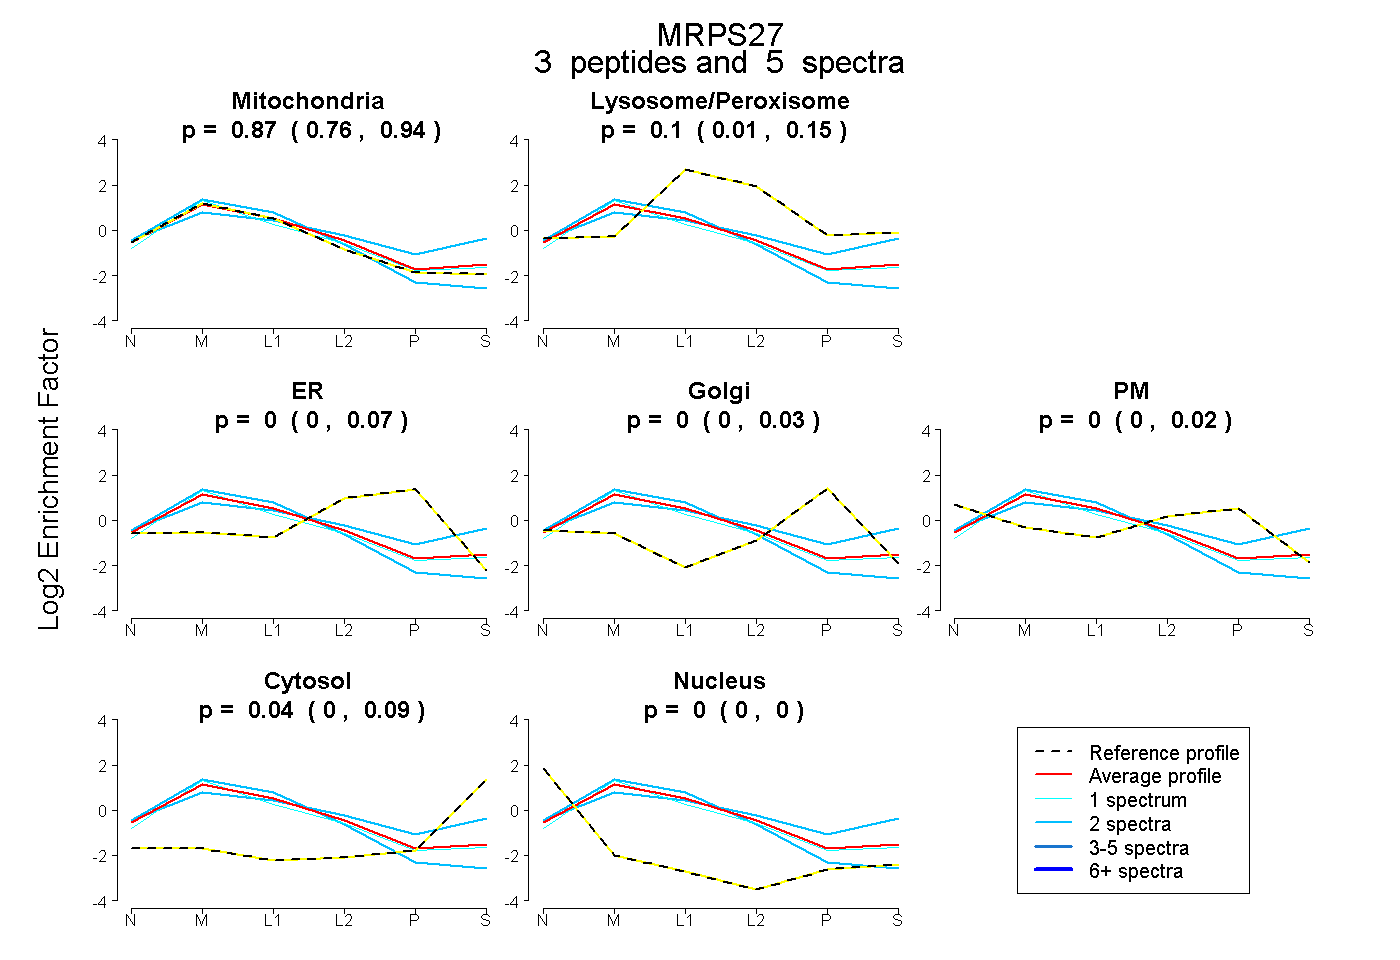 |
0.866 0.759 | 0.940 |
0.097 0.013 | 0.145 |
0.002 0.000 | 0.068 |
0.000 0.000 | 0.030 |
0.000 0.000 | 0.018 |
0.036 0.000 | 0.087 |
0.000 0.000 | 0.000 |
|||
| Plot | Lyso | Other | |||||||||||
| Expt C |
21 peptides |
106 spectra |
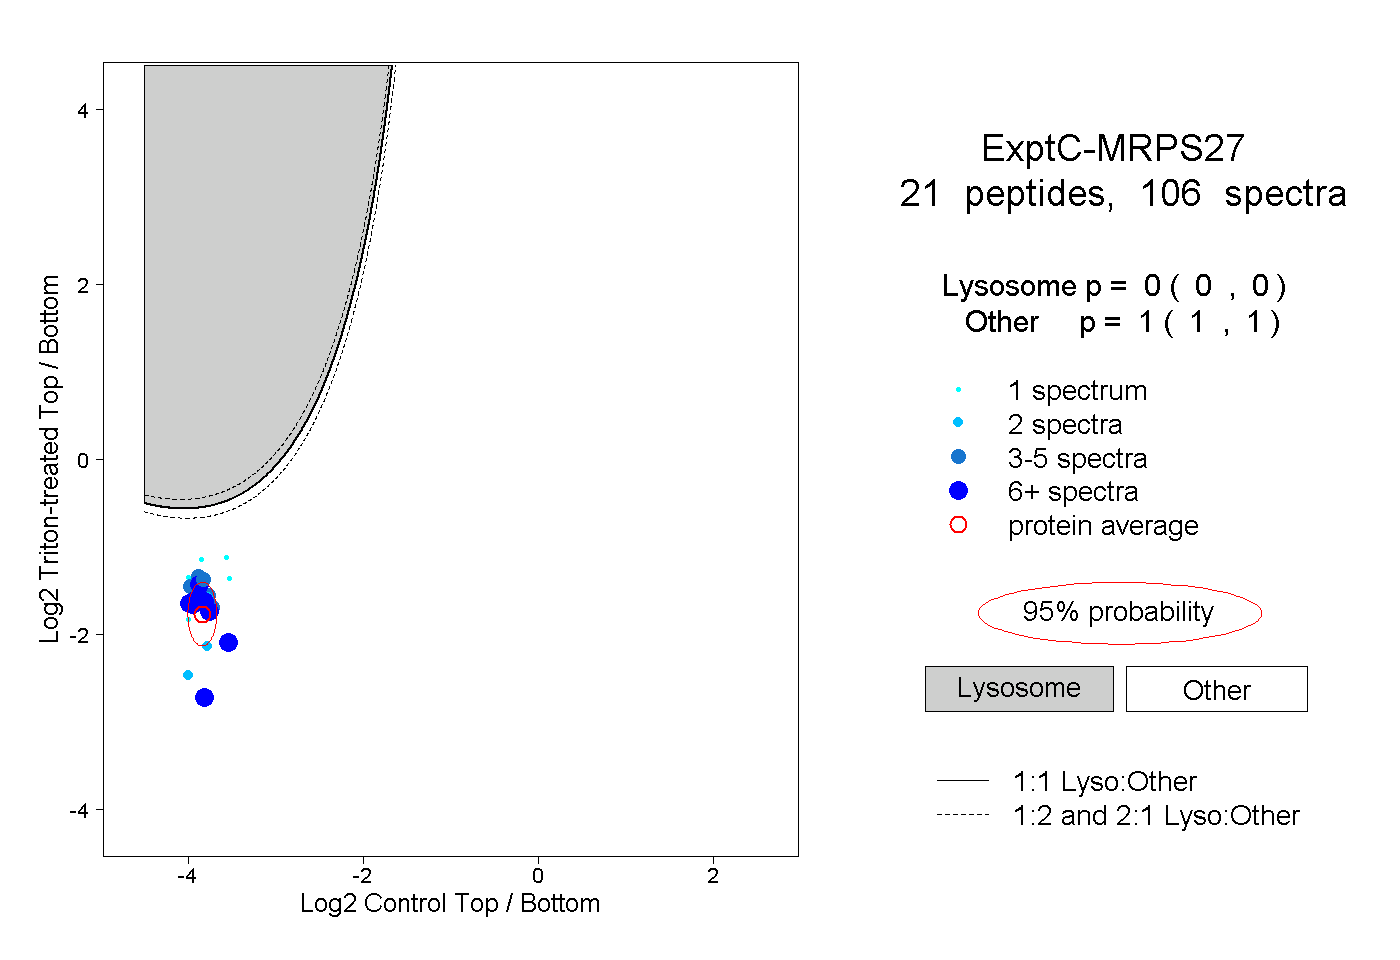 |
0.000 0.000 | 0.000 |
1.000 1.000 | 1.000 |
||||||||
| Plot | Lyso | Other | |||||||||||
| Expt D |
3 peptides |
10 spectra |
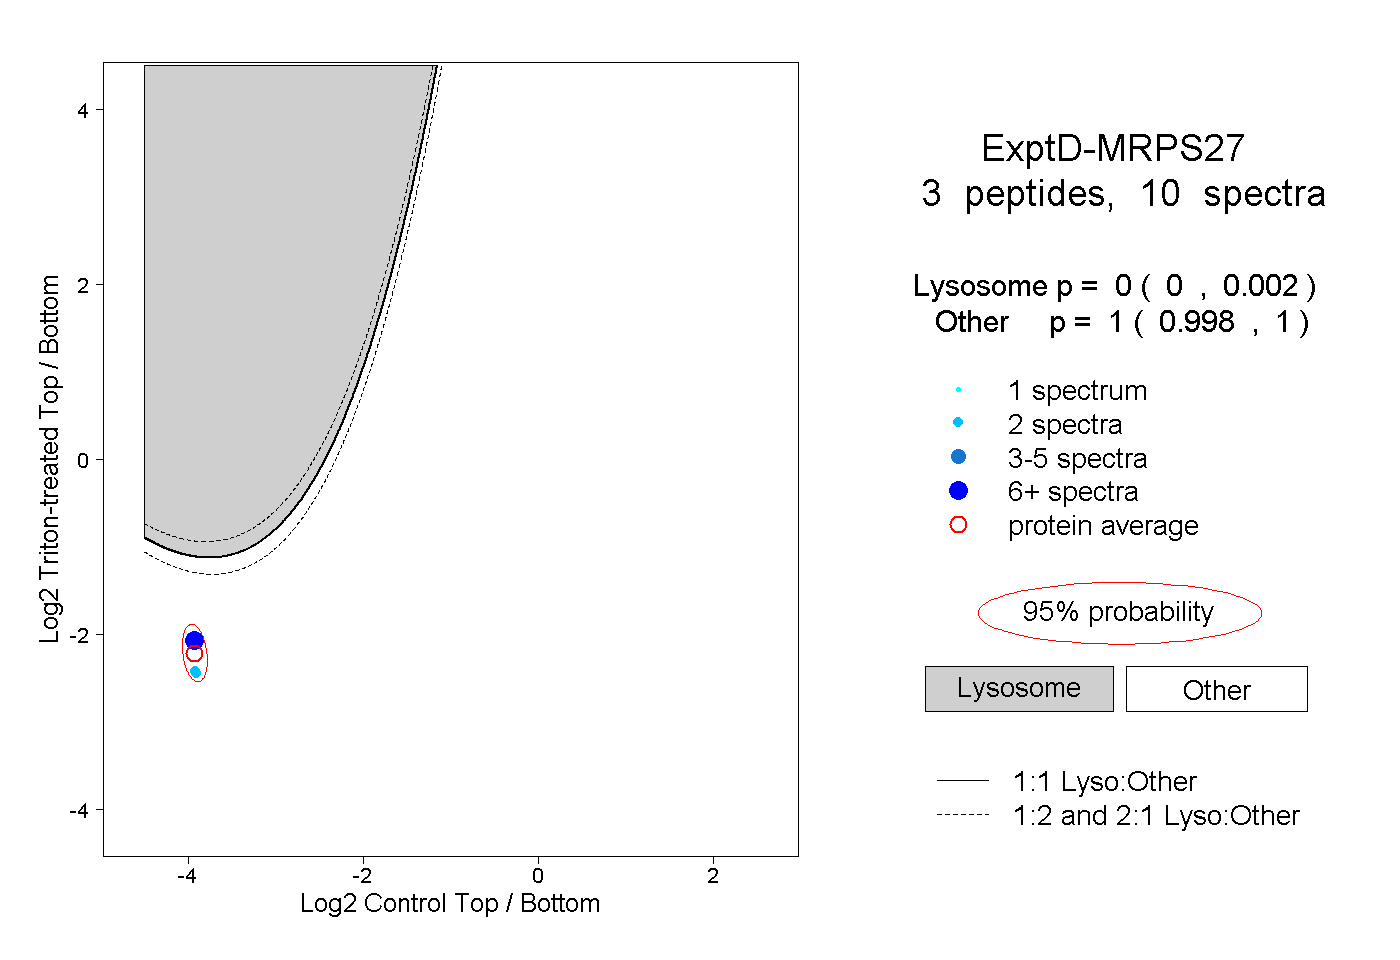 |
0.000 0.000 | 0.002 |
1.000 0.998 | 1.000 |