 8
8peptides
spectra
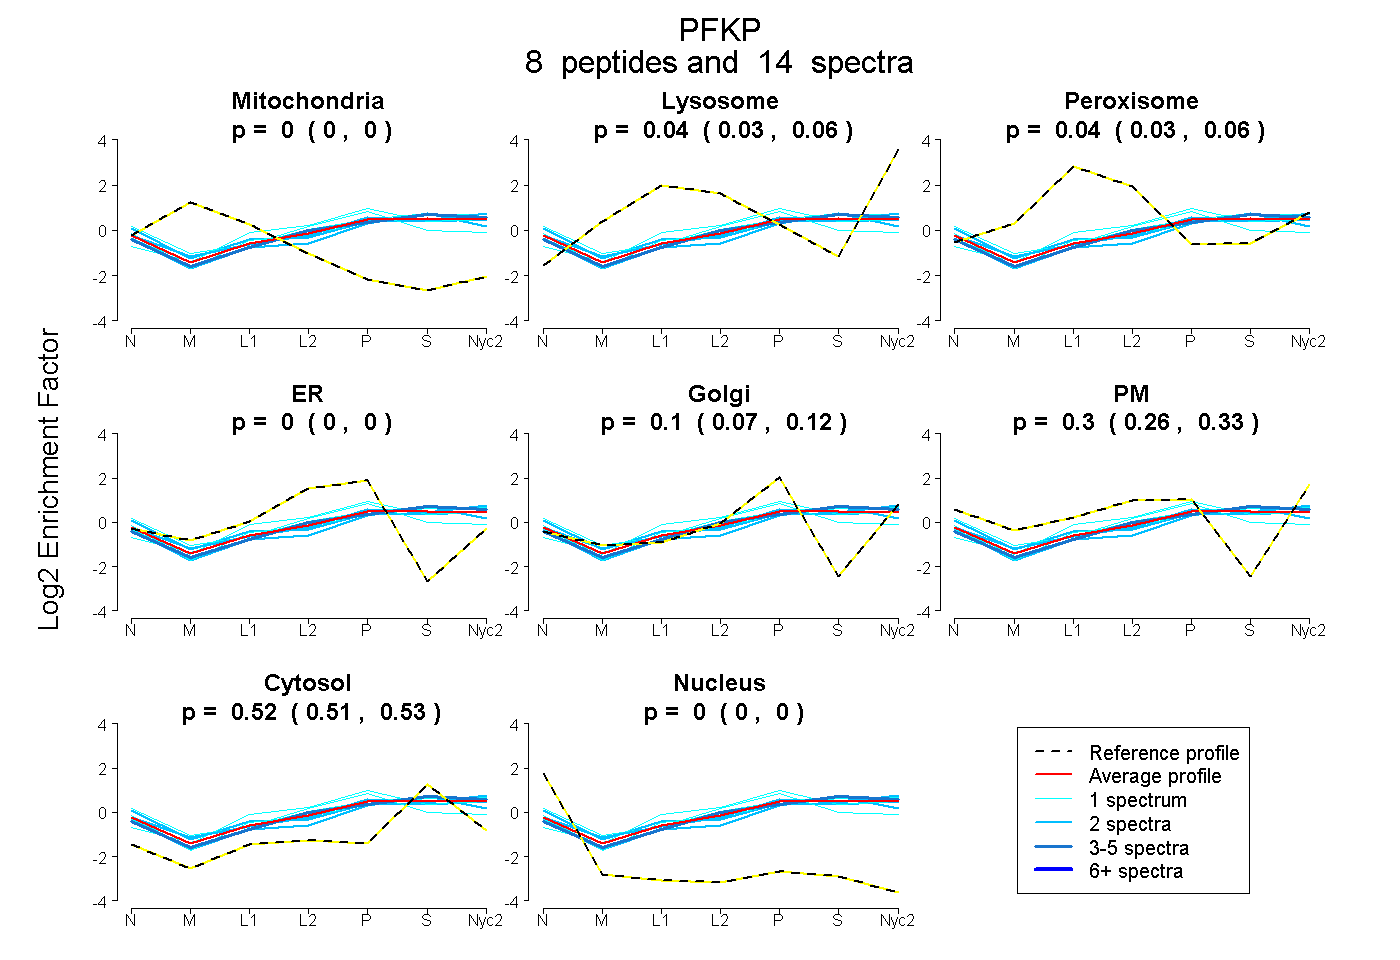
0.000 | 0.000
0.026 | 0.059
0.025 | 0.061
0.000 | 0.000
0.067 | 0.123
0.256 | 0.329
0.508 | 0.527
0.000 | 0.000
1peptide
spectrum
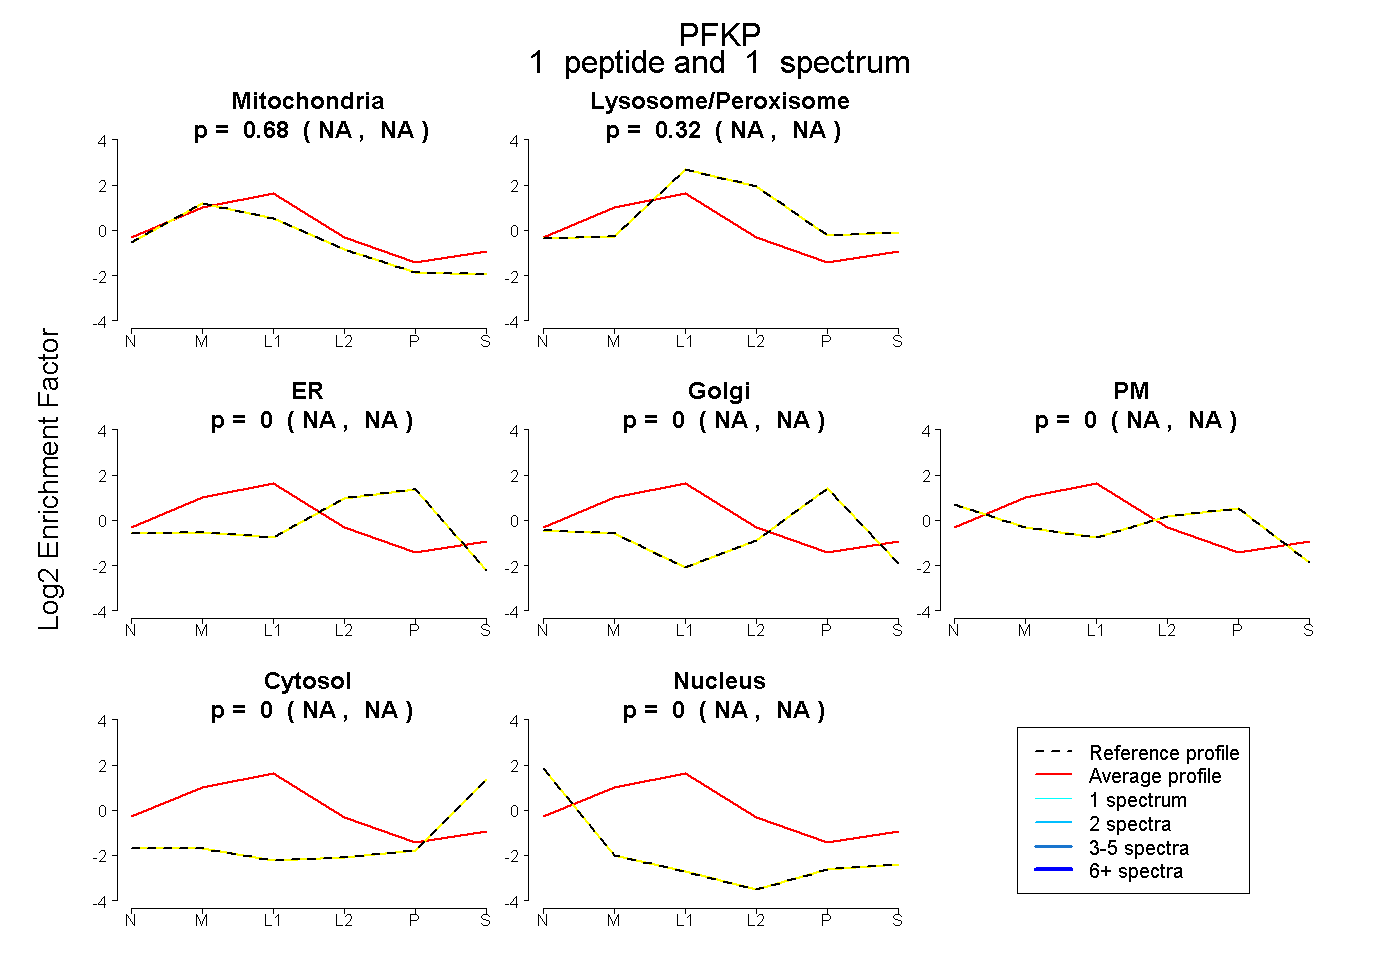
NA | NA
NA | NA
NA | NA
NA | NA
NA | NA
NA | NA
NA | NA
1peptide
spectra
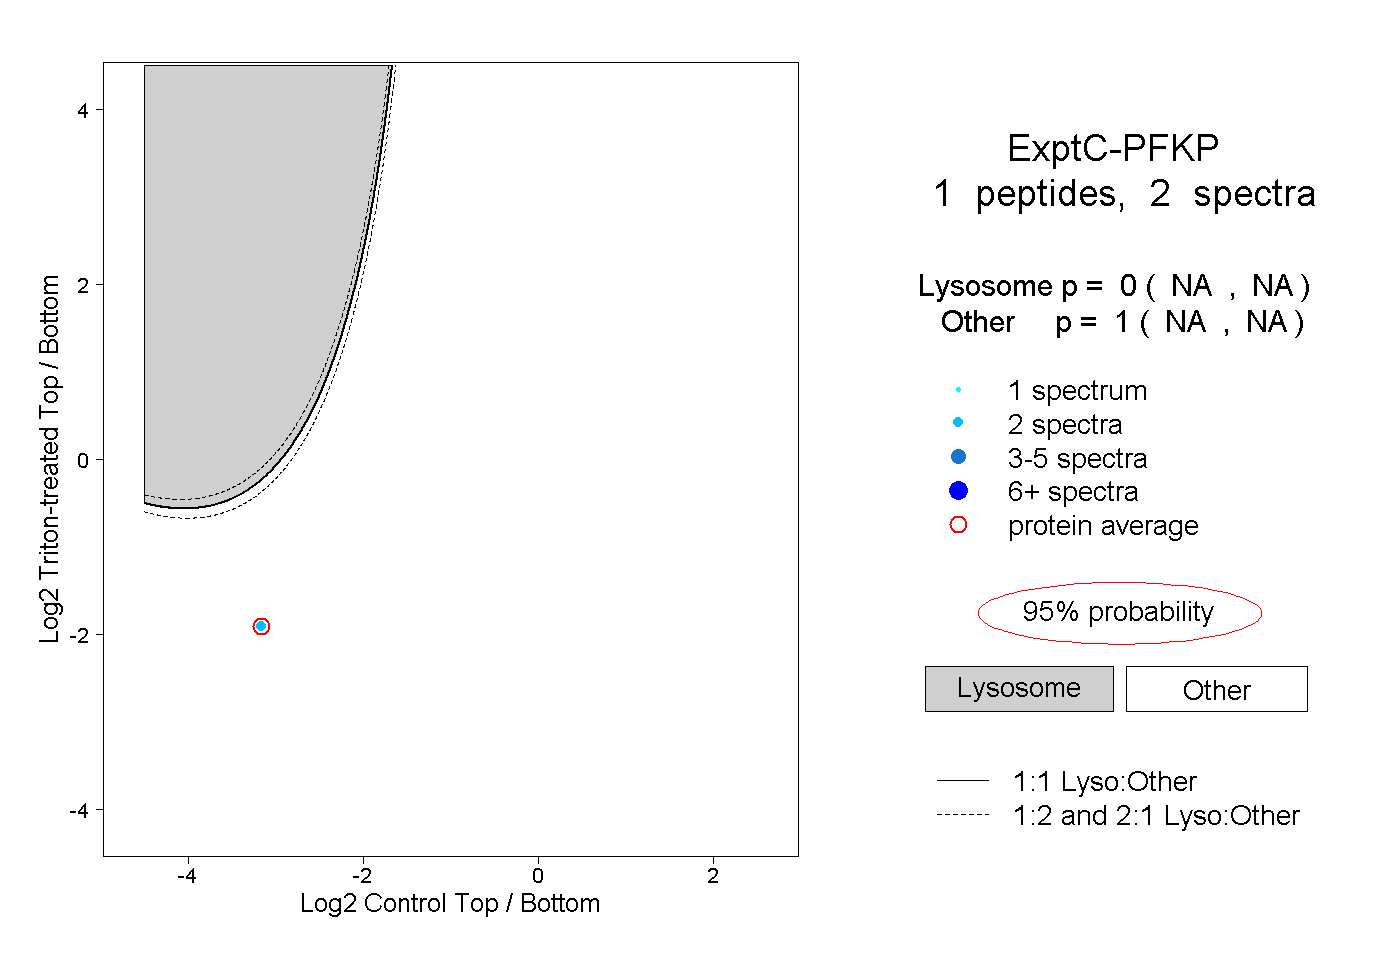
NA | NA
NA | NA
1peptide
spectrum
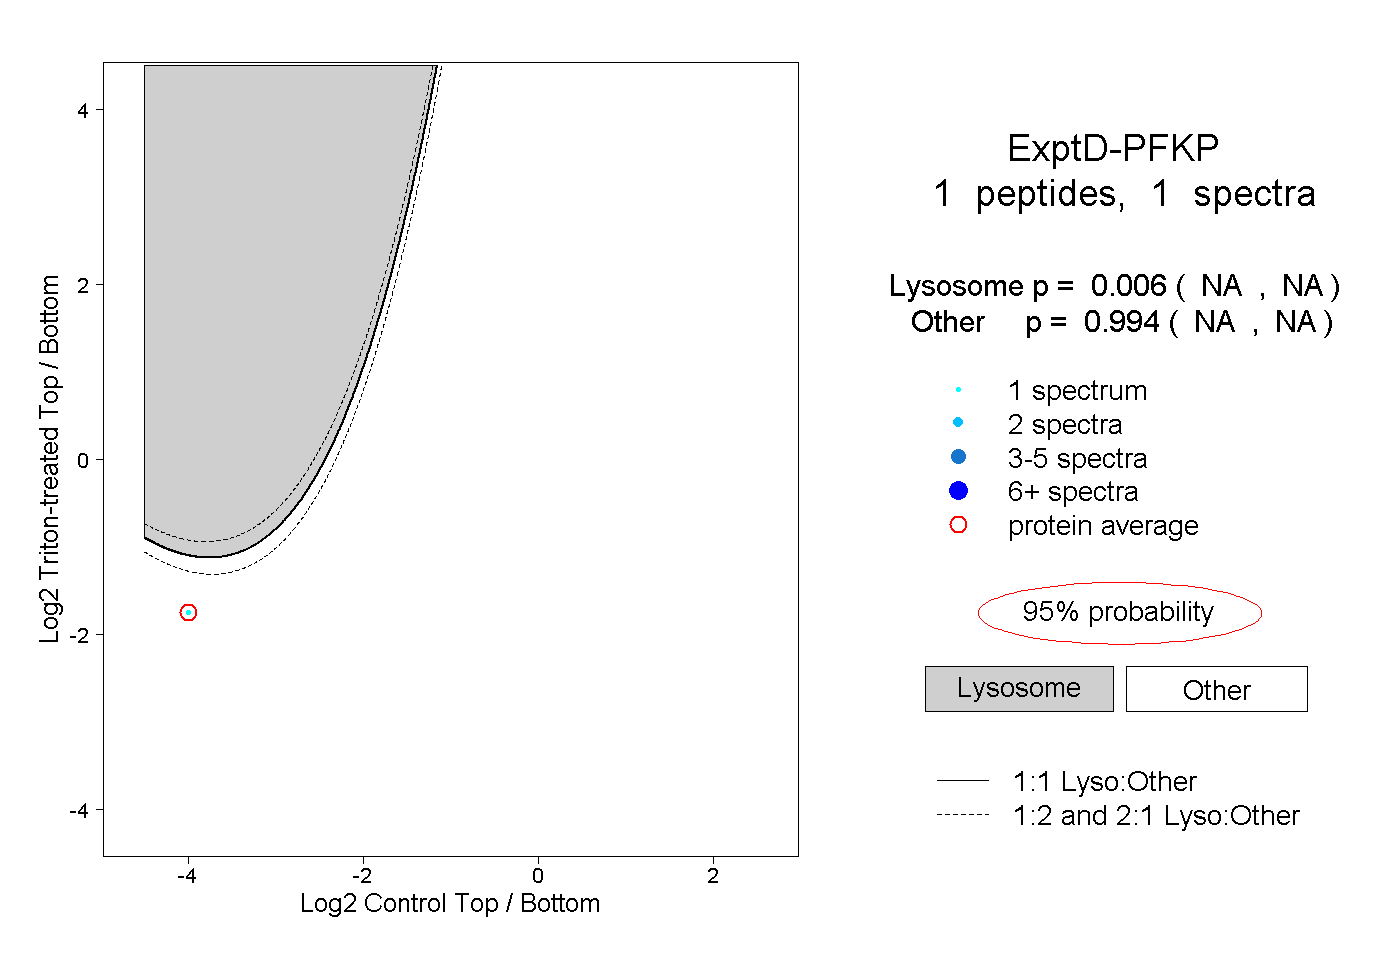
NA | NA
NA | NA