 8
8peptides
spectra
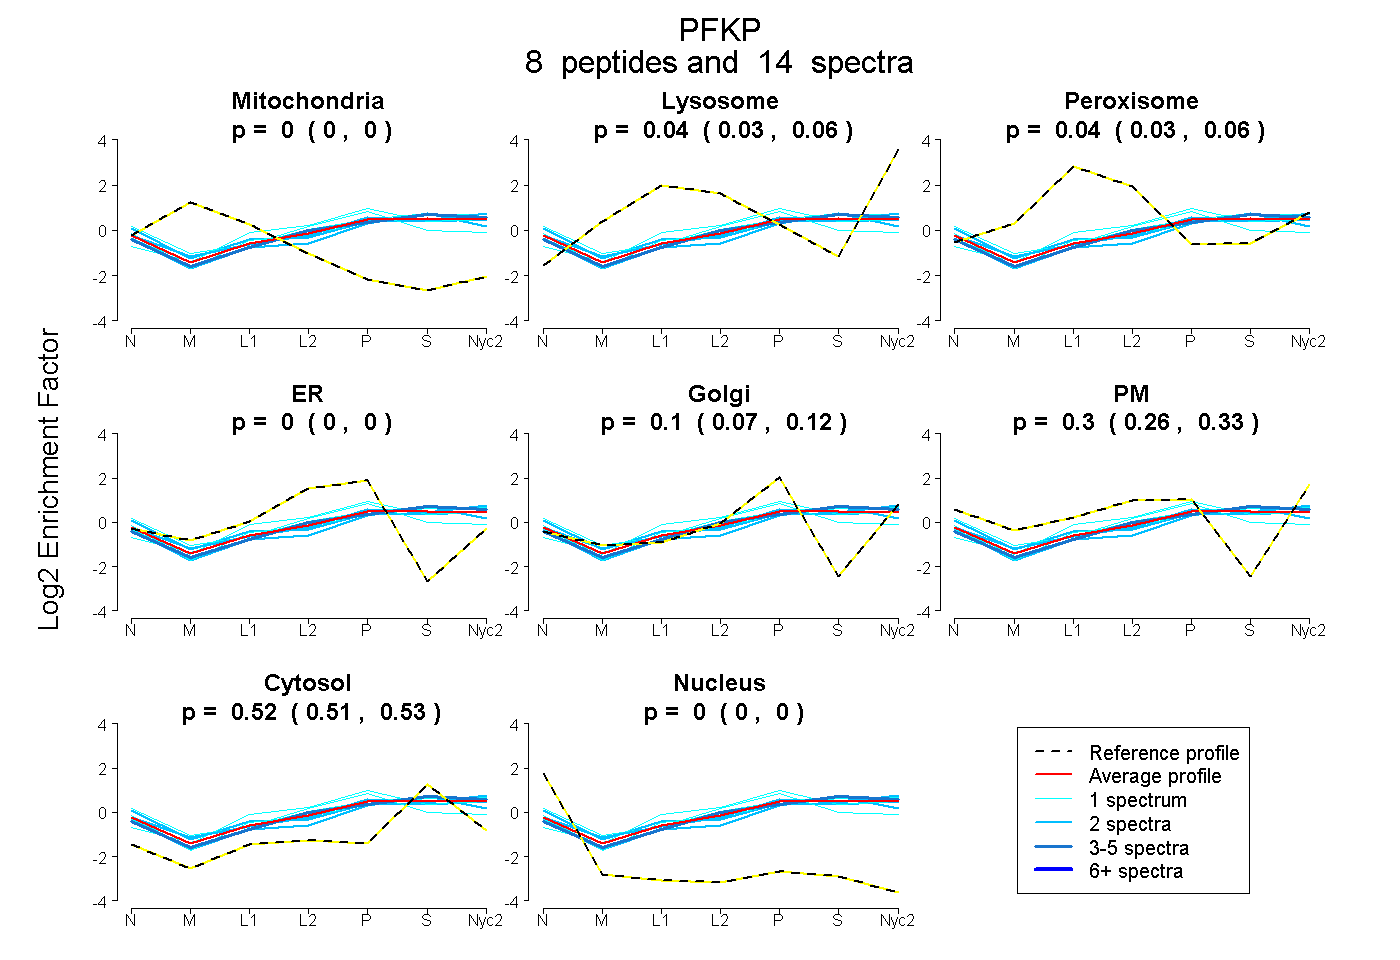
0.000 | 0.000
0.026 | 0.059
0.025 | 0.061
0.000 | 0.000
0.067 | 0.123
0.256 | 0.329
0.508 | 0.527
0.000 | 0.000
| Plot | Mito | Lyso | Perox | ER | Golgi | PM | Cytosol | Nucleus | |||||
| Expt A |
8 peptides |
14 spectra |
|
0.000 0.000 | 0.000 |
0.043 0.026 | 0.059 |
0.045 0.025 | 0.061 |
0.000 0.000 | 0.000 |
0.097 0.067 | 0.123 |
0.296 0.256 | 0.329 |
0.519 0.508 | 0.527 |
0.000 0.000 | 0.000 |
| 1 spectrum, EWSGLLEELAK | 0.000 | 0.080 | 0.000 | 0.000 | 0.000 | 0.361 | 0.558 | 0.000 | ||
| 2 spectra, NVLGHMQQGGAPSPFDR | 0.000 | 0.105 | 0.000 | 0.000 | 0.115 | 0.292 | 0.488 | 0.000 | ||
| 1 spectrum, DLLFKPVAELR | 0.000 | 0.204 | 0.005 | 0.018 | 0.177 | 0.063 | 0.532 | 0.000 | ||
| 2 spectra, ELVVTNLGFDTR | 0.000 | 0.010 | 0.025 | 0.000 | 0.128 | 0.222 | 0.615 | 0.000 | ||
| 2 spectra, AMEWISAK | 0.000 | 0.000 | 0.050 | 0.000 | 0.000 | 0.443 | 0.508 | 0.000 | ||
| 4 spectra, VTILGHVQR | 0.000 | 0.104 | 0.000 | 0.000 | 0.064 | 0.263 | 0.569 | 0.000 | ||
| 1 spectrum, ATDFEHR | 0.000 | 0.000 | 0.002 | 0.248 | 0.000 | 0.316 | 0.434 | 0.000 | ||
| 1 spectrum, LRPIMK | 0.000 | 0.034 | 0.226 | 0.000 | 0.375 | 0.000 | 0.365 | 0.000 |
| Plot | Mito | Lyso or Perox | ER | Golgi | PM | Cytosol | Nucleus | ||||||
| Expt B |
1 peptide |
1 spectrum |
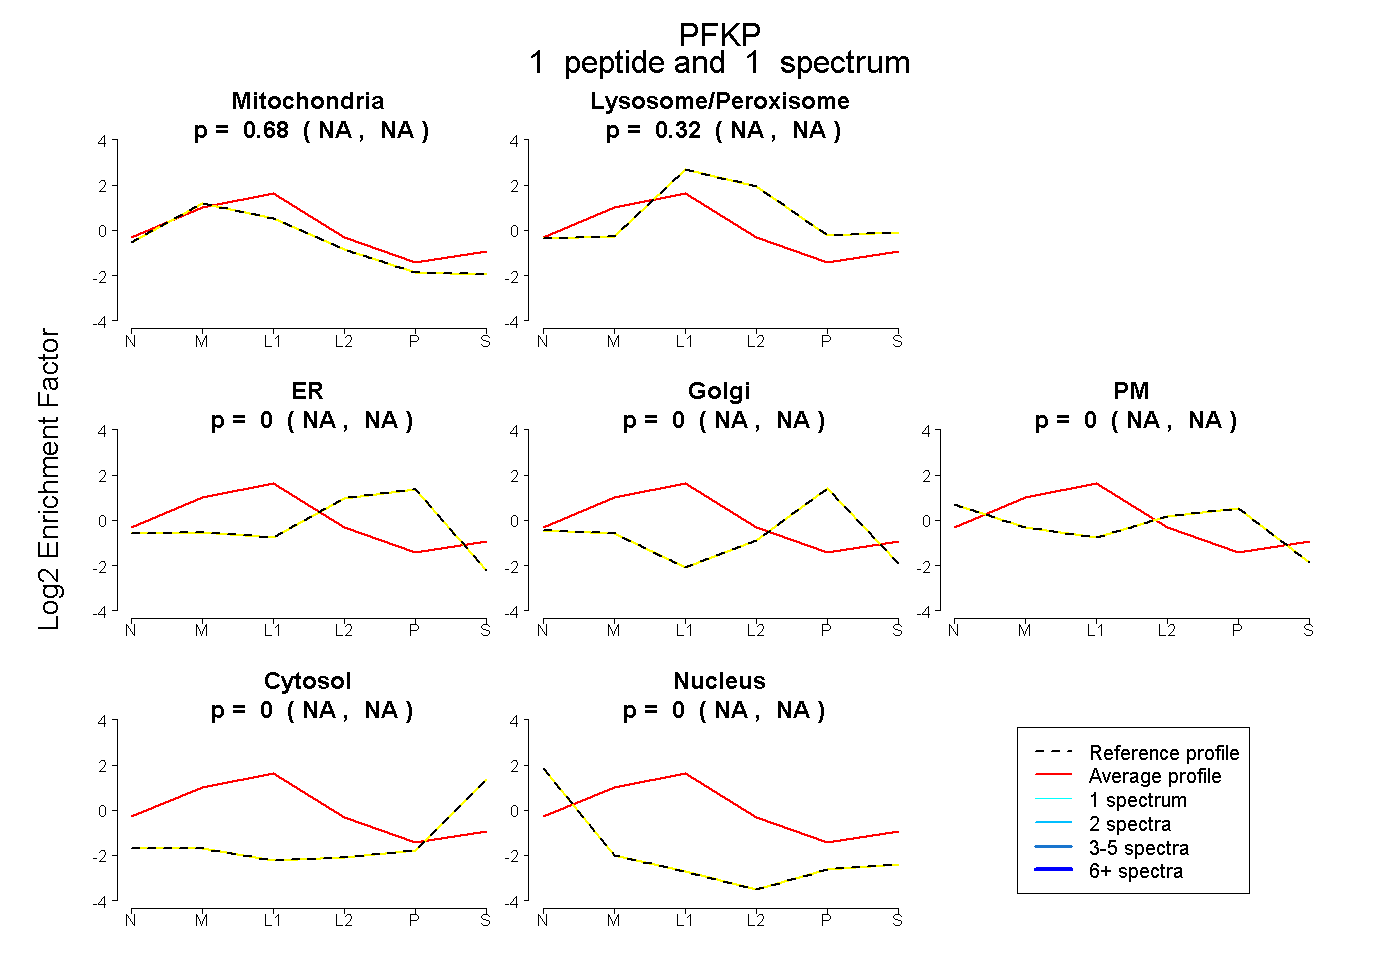 |
0.678 NA | NA |
0.322 NA | NA |
0.000 NA | NA |
0.000 NA | NA |
0.000 NA | NA |
0.000 NA | NA |
0.000 NA | NA |
|||
| Plot | Lyso | Other | |||||||||||
| Expt C |
1 peptide |
2 spectra |
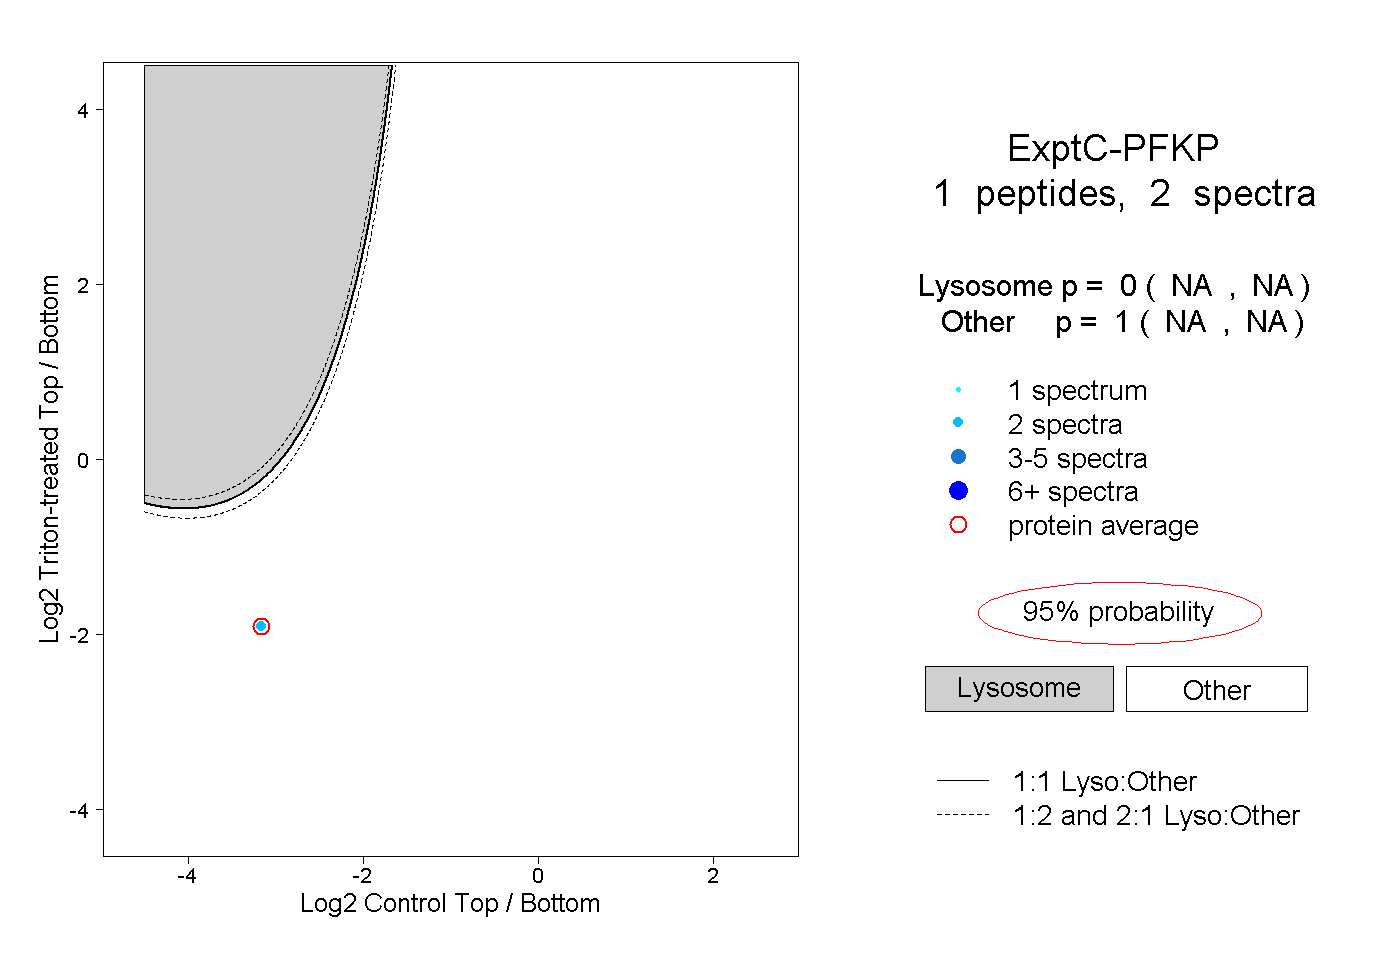 |
0.000 NA | NA |
1.000 NA | NA |
||||||||
| Plot | Lyso | Other | |||||||||||
| Expt D |
1 peptide |
1 spectrum |
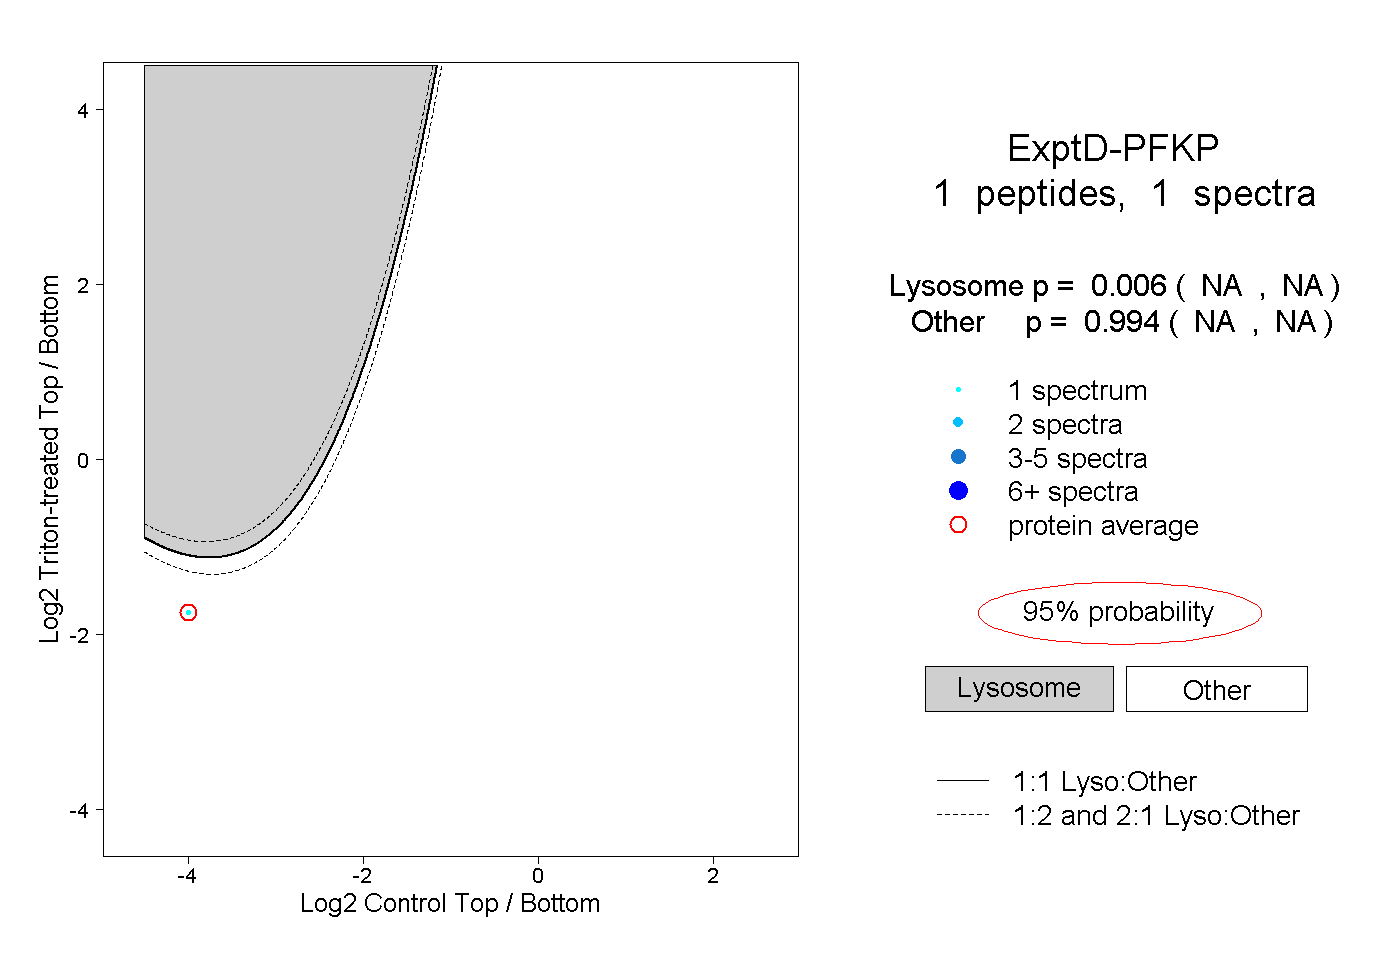 |
0.006 NA | NA |
0.994 NA | NA |