 7
7peptides
spectra

0.000 | 0.000
0.051 | 0.091
0.000 | 0.000
0.165 | 0.234
0.000 | 0.000
0.686 | 0.761
0.000 | 0.000
0.000 | 0.000
2peptides
spectra
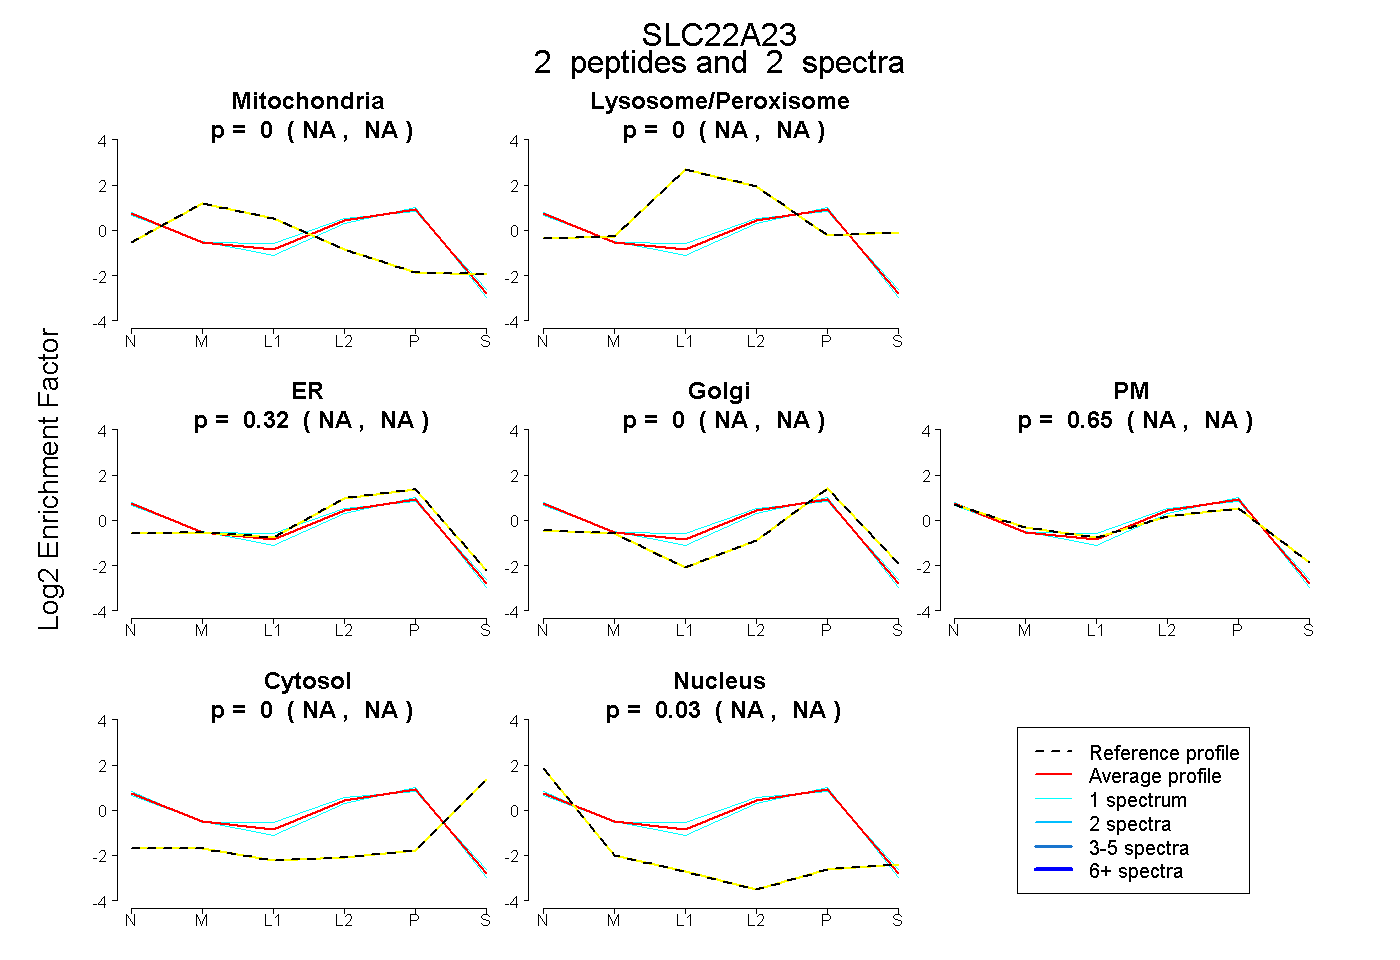
NA | NA
NA | NA
NA | NA
NA | NA
NA | NA
NA | NA
NA | NA
8peptides
spectra
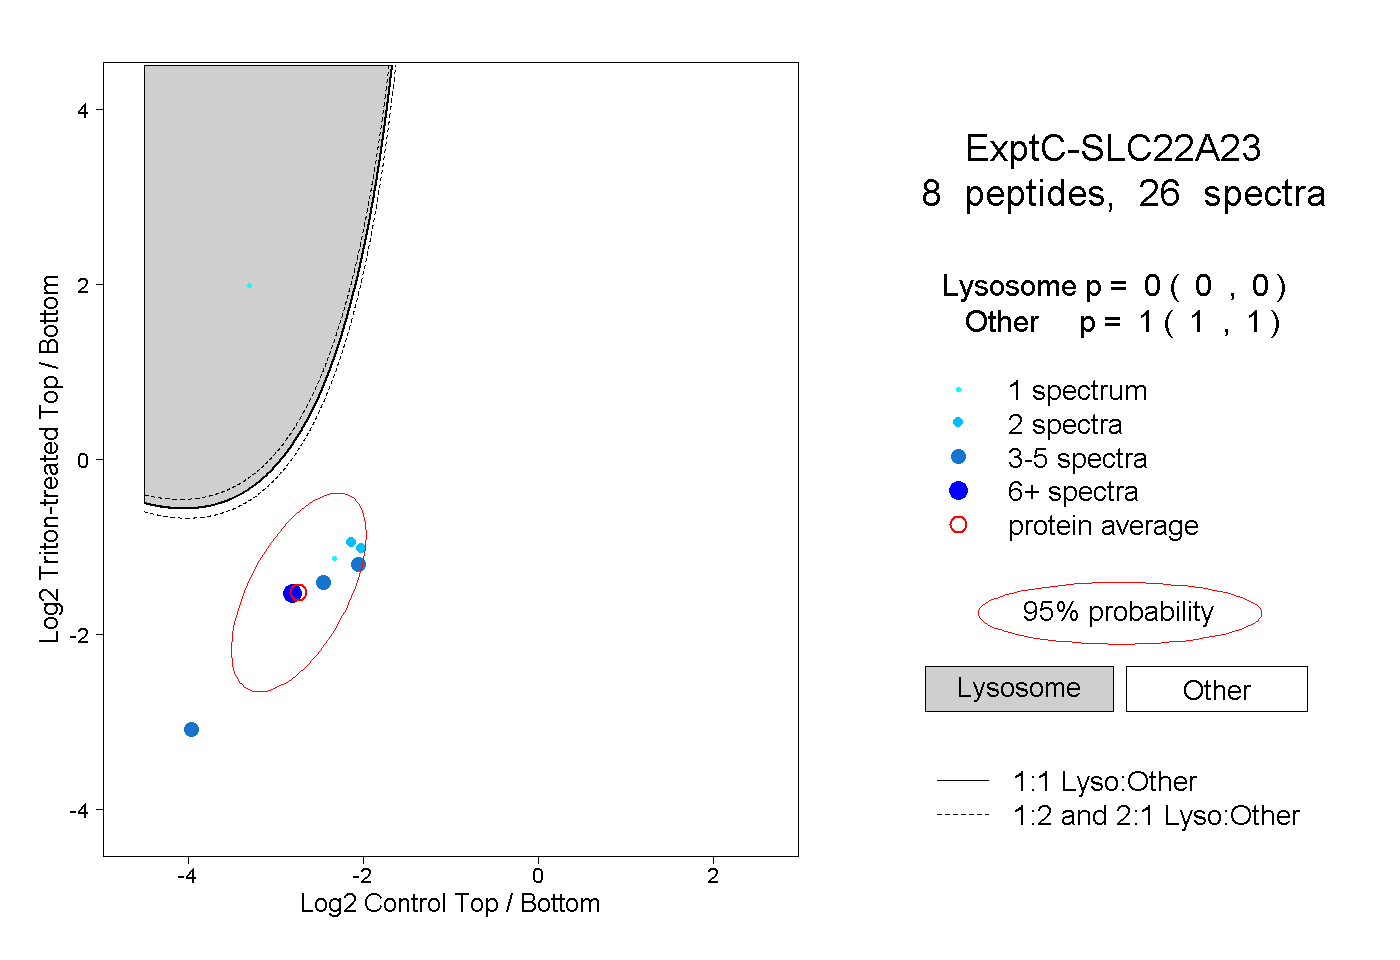
0.000 | 0.000
1.000 | 1.000
1peptide
spectrum
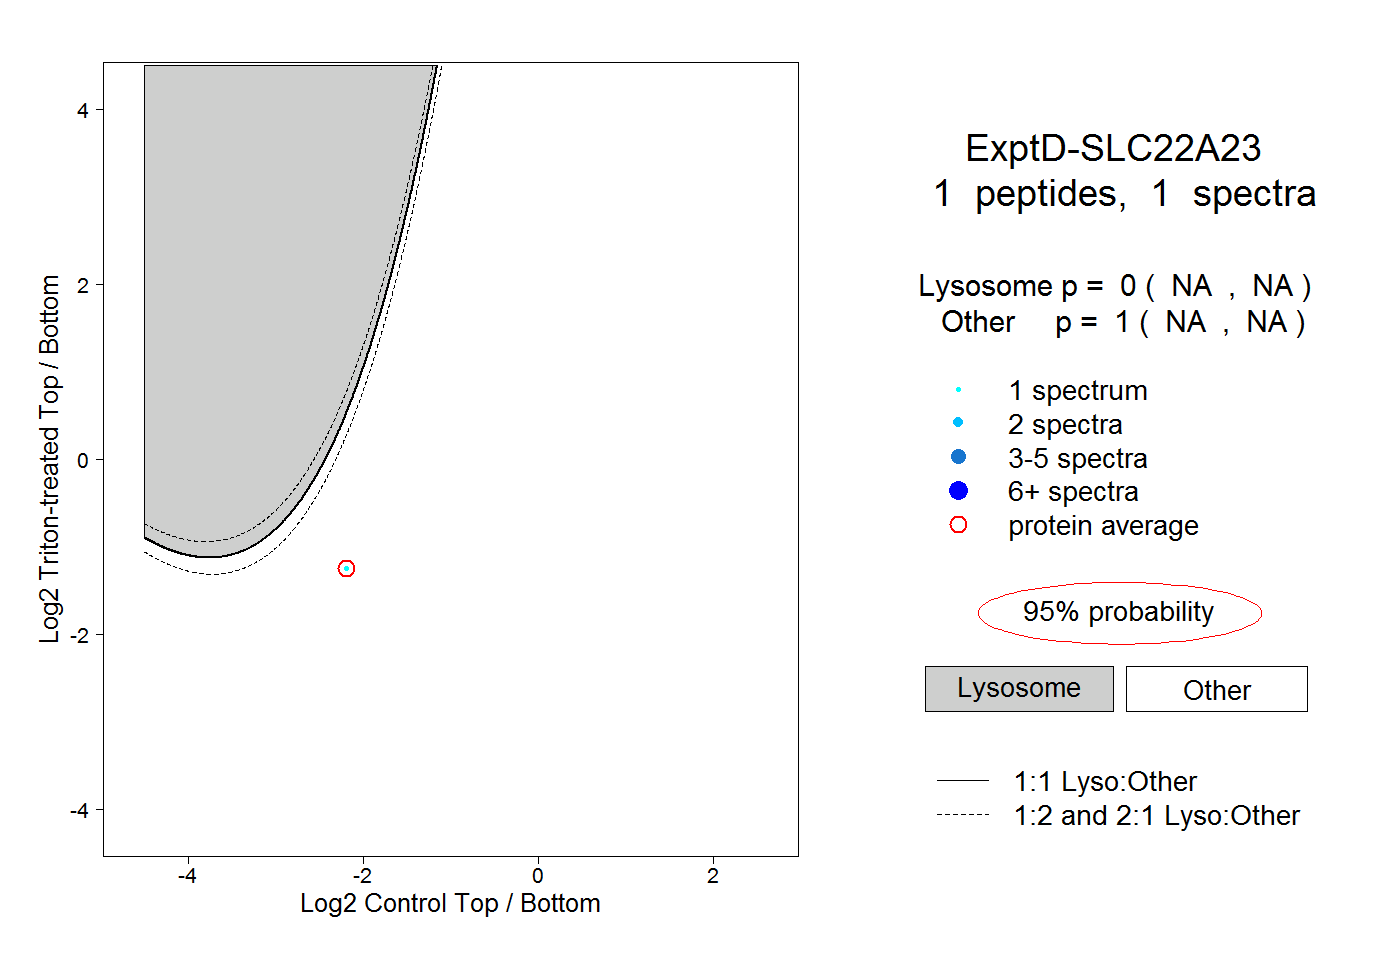
NA | NA
NA | NA