 7
7peptides
spectra

0.000 | 0.000
0.051 | 0.091
0.000 | 0.000
0.165 | 0.234
0.000 | 0.000
0.686 | 0.761
0.000 | 0.000
0.000 | 0.000
| Plot | Mito | Lyso | Perox | ER | Golgi | PM | Cytosol | Nucleus | |||||
| Expt A |
7 peptides |
16 spectra |
|
0.000 0.000 | 0.000 |
0.073 0.051 | 0.091 |
0.000 0.000 | 0.000 |
0.202 0.165 | 0.234 |
0.000 0.000 | 0.000 |
0.725 0.686 | 0.761 |
0.000 0.000 | 0.000 |
0.000 0.000 | 0.000 |
| 4 spectra, NCVSPESDIK | 0.000 | 0.017 | 0.000 | 0.207 | 0.000 | 0.776 | 0.000 | 0.000 | ||
| 2 spectra, GVMPELEK | 0.000 | 0.193 | 0.000 | 0.029 | 0.000 | 0.779 | 0.000 | 0.000 | ||
| 3 spectra, QPLLSHK | 0.000 | 0.034 | 0.176 | 0.041 | 0.430 | 0.230 | 0.089 | 0.000 | ||
| 3 spectra, WDLVCDNAWK | 0.053 | 0.012 | 0.000 | 0.233 | 0.000 | 0.702 | 0.000 | 0.000 | ||
| 1 spectrum, LILYLTQK | 0.000 | 0.186 | 0.000 | 0.146 | 0.000 | 0.668 | 0.000 | 0.000 | ||
| 1 spectrum, TGLVQNVVSK | 0.000 | 0.017 | 0.000 | 0.019 | 0.000 | 0.965 | 0.000 | 0.000 | ||
| 2 spectra, GTELAGATVTGR | 0.000 | 0.000 | 0.000 | 0.316 | 0.000 | 0.684 | 0.000 | 0.000 |
| Plot | Mito | Lyso or Perox | ER | Golgi | PM | Cytosol | Nucleus | ||||||
| Expt B |
2 peptides |
2 spectra |
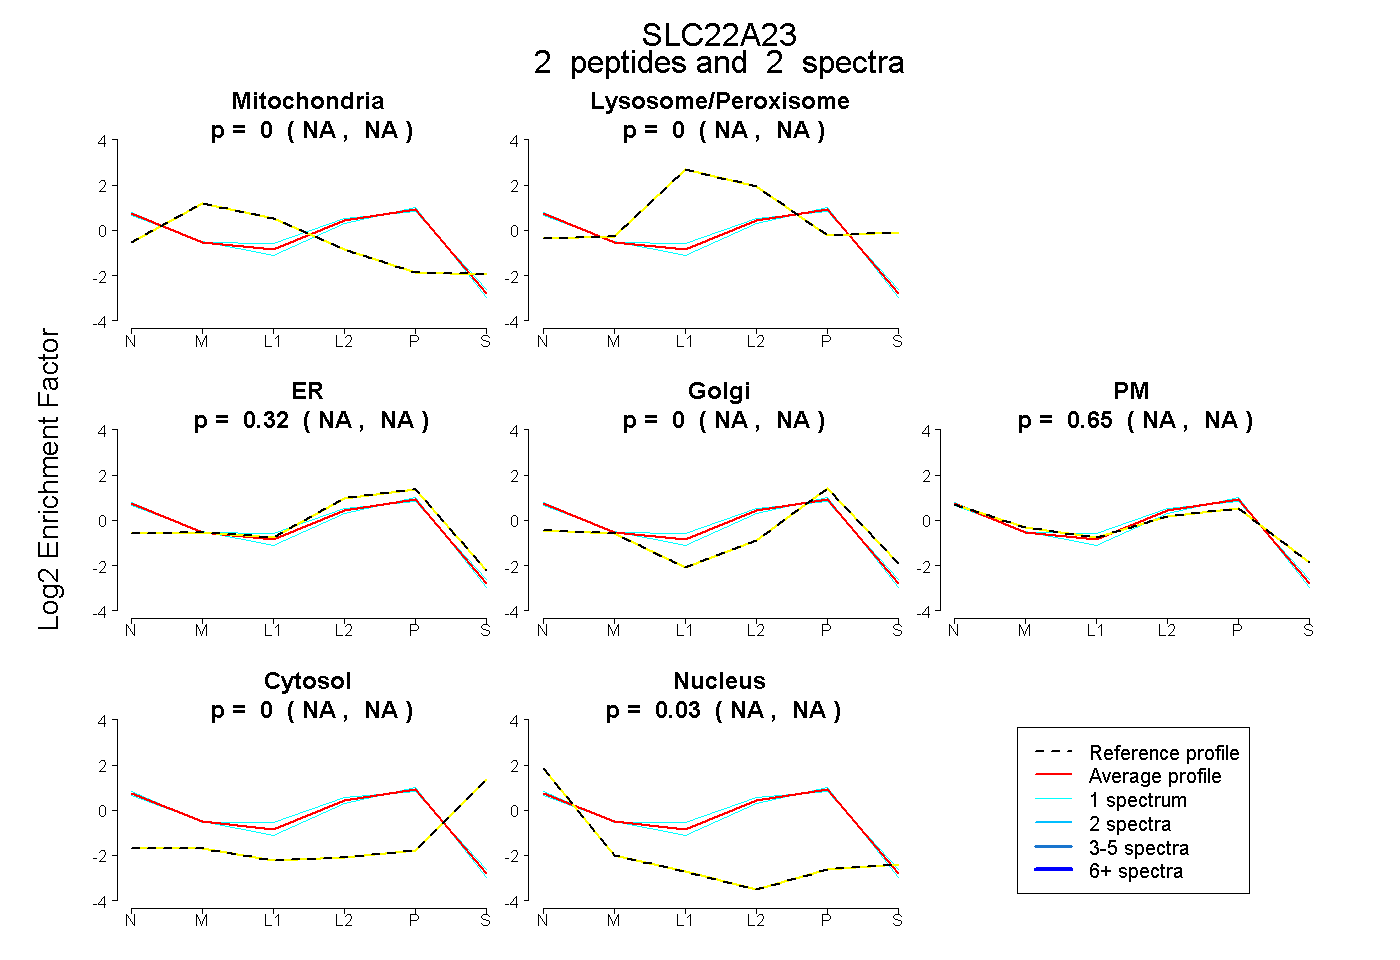 |
0.000 NA | NA |
0.000 NA | NA |
0.321 NA | NA |
0.000 NA | NA |
0.651 NA | NA |
0.000 NA | NA |
0.027 NA | NA |
|||
| Plot | Lyso | Other | |||||||||||
| Expt C |
8 peptides |
26 spectra |
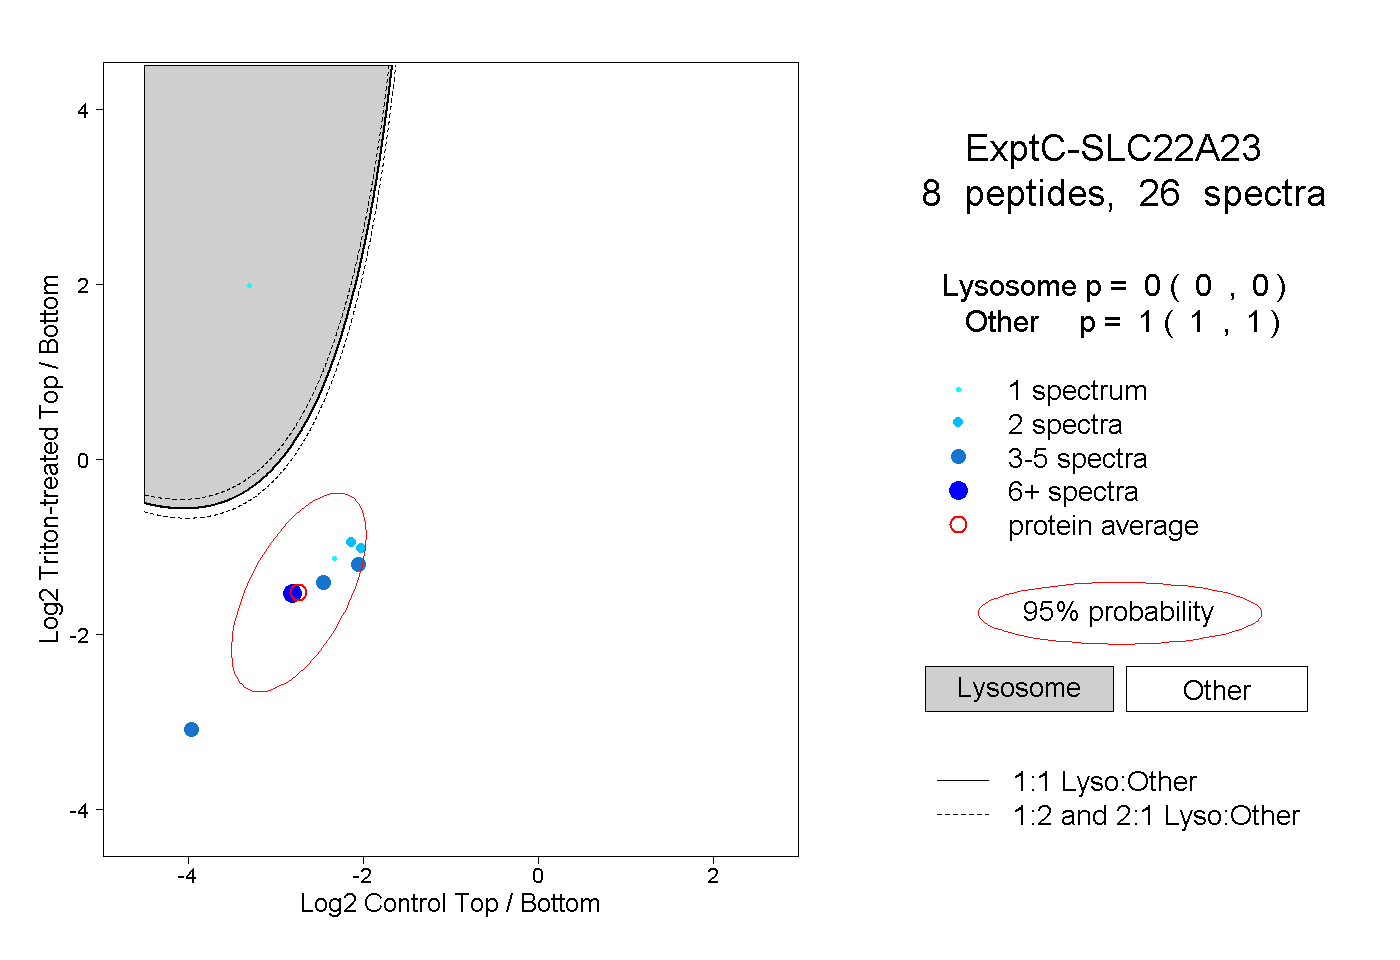 |
0.000 0.000 | 0.000 |
1.000 1.000 | 1.000 |
||||||||
| Plot | Lyso | Other | |||||||||||
| Expt D |
1 peptide |
1 spectrum |
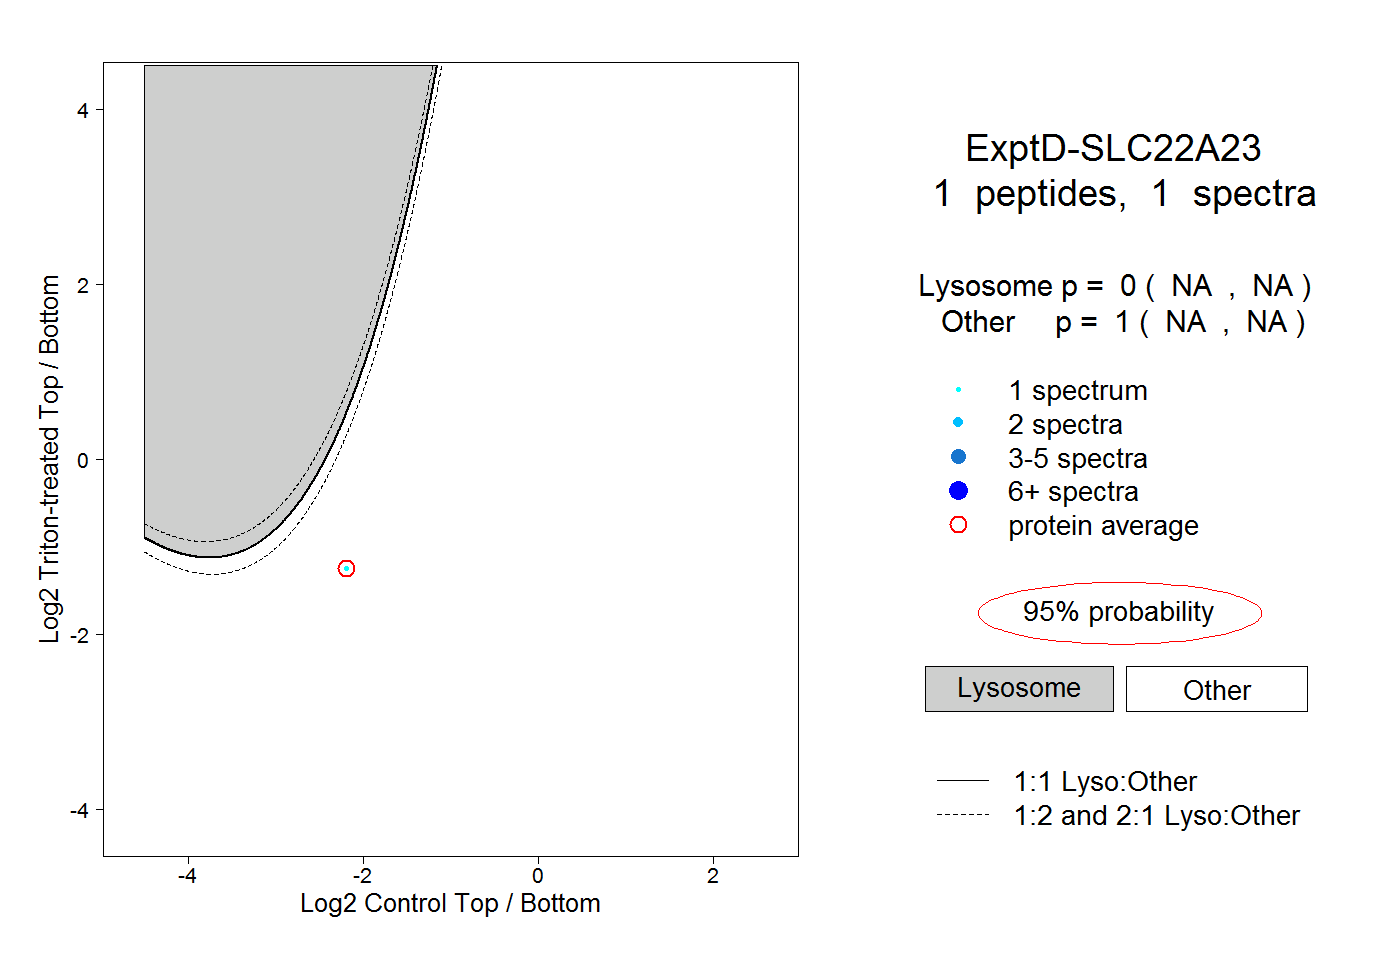 |
0.000 NA | NA |
1.000 NA | NA |