 3
3peptides
spectra
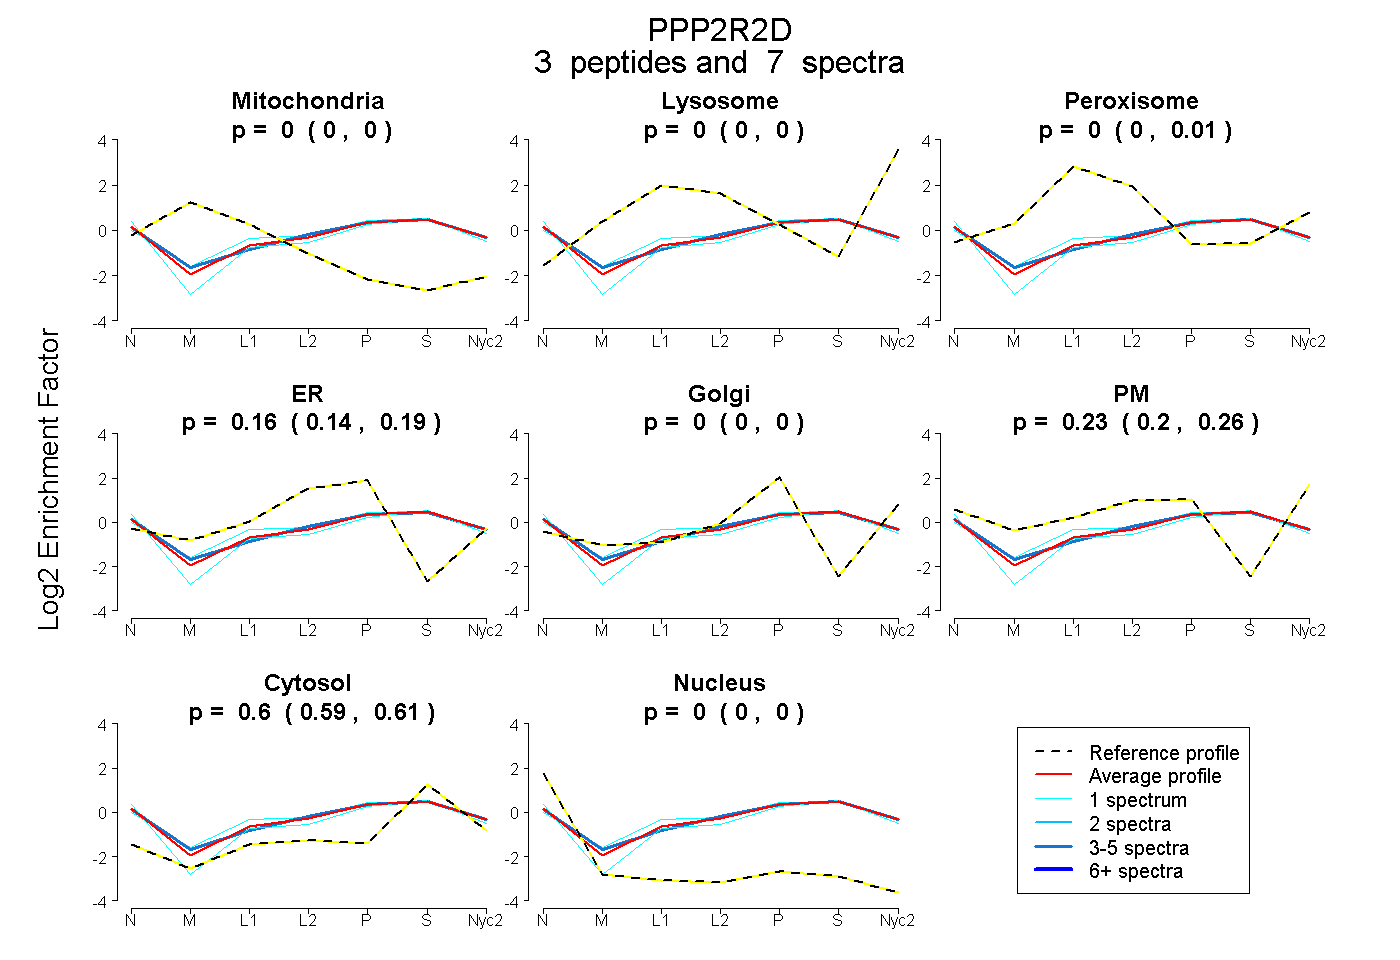
0.000 | 0.000
0.000 | 0.000
0.000 | 0.008
0.137 | 0.186
0.000 | 0.000
0.198 | 0.261
0.586 | 0.614
0.000 | 0.000
3peptides
spectra
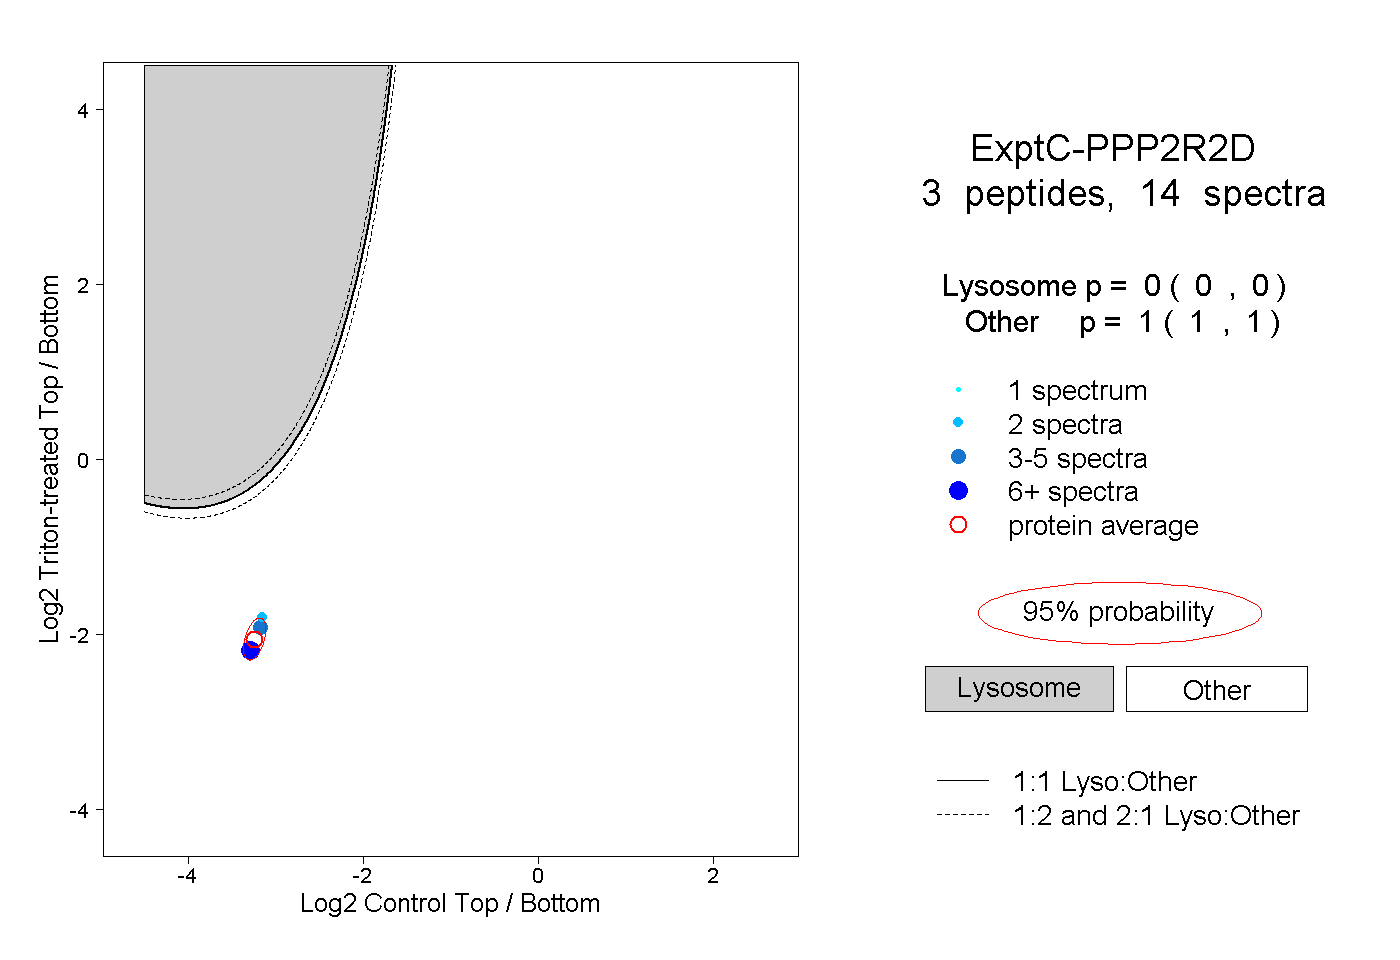
0.000 | 0.000
1.000 | 1.000
1peptide
spectrum
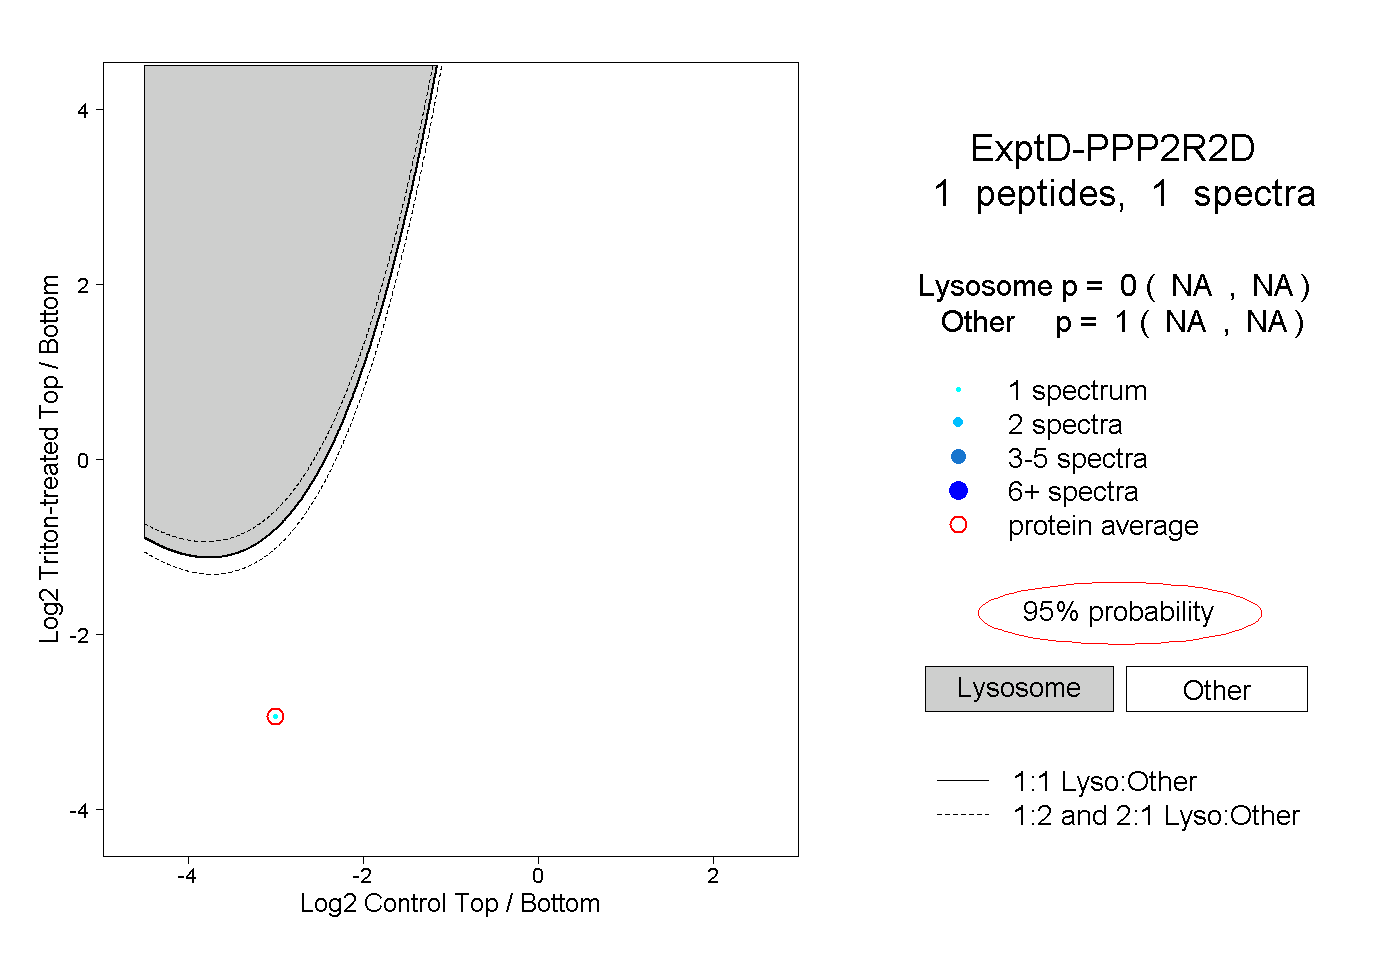
NA | NA
NA | NA