 3
3peptides
spectra
0.000 | 0.000
0.000 | 0.000
0.000 | 0.008
0.137 | 0.186
0.000 | 0.000
0.198 | 0.261
0.586 | 0.614
0.000 | 0.000
| Plot | Mito | Lyso | Perox | ER | Golgi | PM | Cytosol | Nucleus | |||||
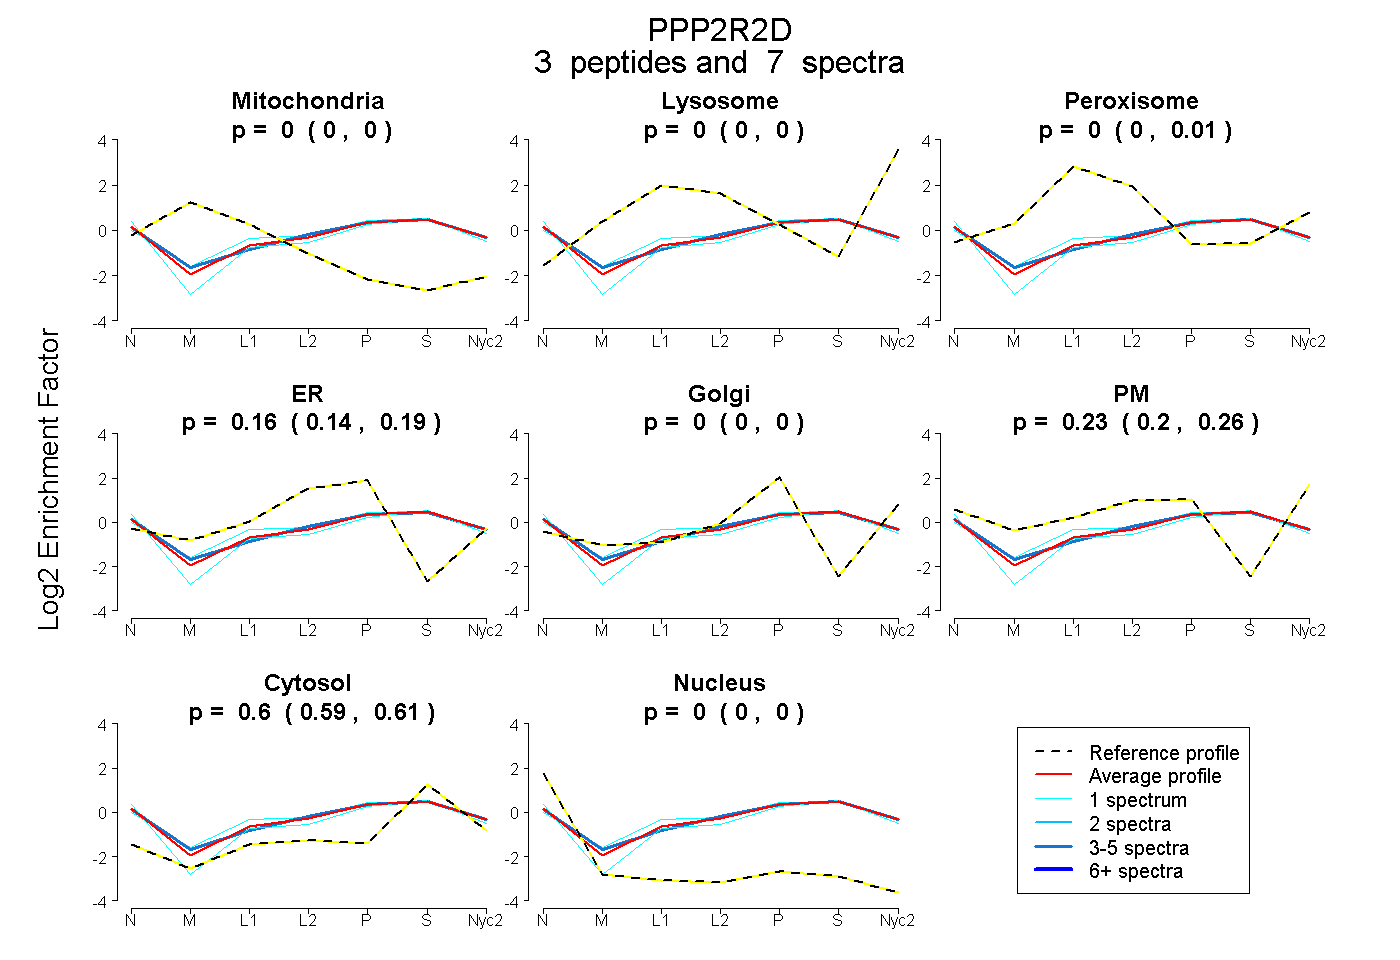
| Expt A |
3 peptides |
7 spectra |
|
0.000 0.000 | 0.000 |
0.000 0.000 | 0.000 |
0.000 0.000 | 0.008 |
0.164 0.137 | 0.186 |
0.000 0.000 | 0.000 |
0.234 0.198 | 0.261 |
0.602 0.586 | 0.614 |
0.000 0.000 | 0.000 |
| 1 spectrum, VVIFQR | 0.000 | 0.000 | 0.000 | 0.151 | 0.006 | 0.167 | 0.636 | 0.040 | ||
| 1 spectrum, ASLKPR | 0.000 | 0.000 | 0.087 | 0.163 | 0.031 | 0.169 | 0.549 | 0.000 | ||
| 5 spectra, FFEEPEDPSSR | 0.000 | 0.000 | 0.000 | 0.167 | 0.000 | 0.245 | 0.587 | 0.000 |
| Plot | Lyso | Other | |||||||||||
| Expt C |
3 peptides |
14 spectra |
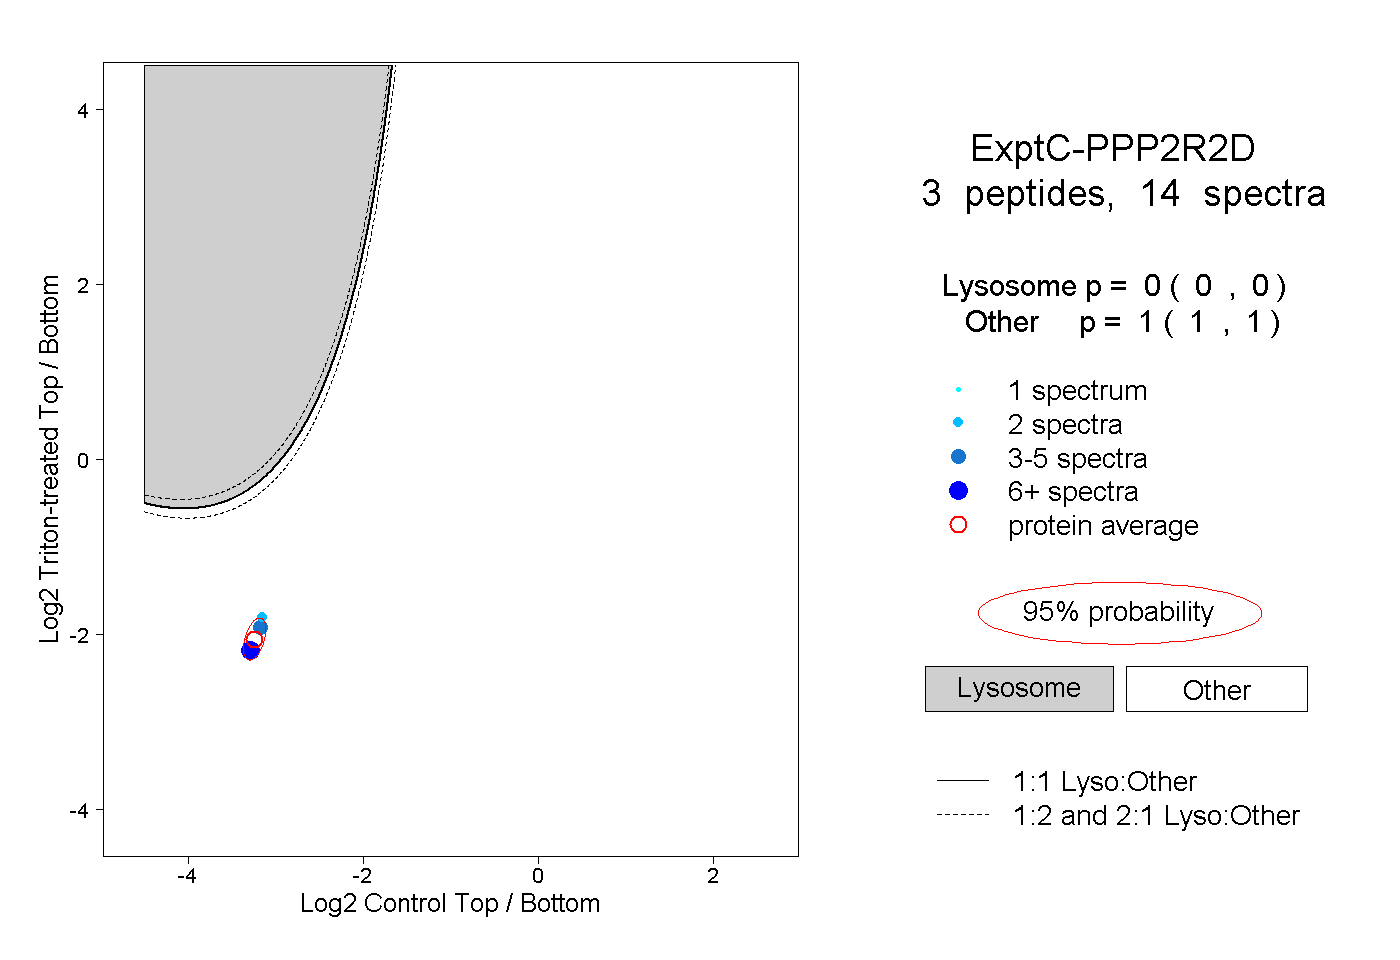 |
0.000 0.000 | 0.000 |
1.000 1.000 | 1.000 |
||||||||
| Plot | Lyso | Other | |||||||||||
| Expt D |
1 peptide |
1 spectrum |
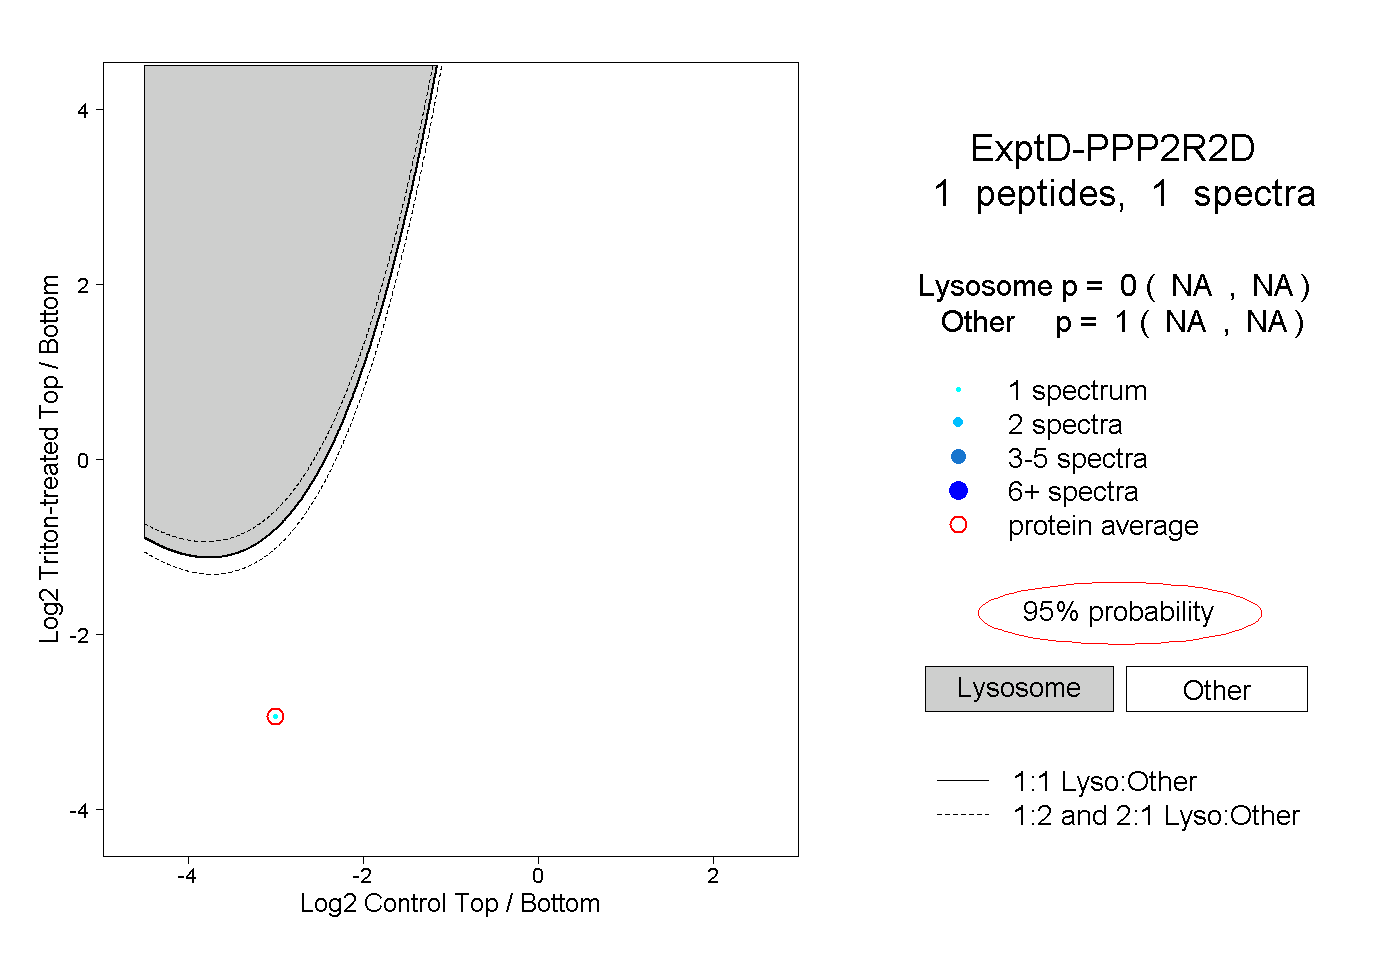 |
0.000 NA | NA |
1.000 NA | NA |