 5
5peptides
spectra
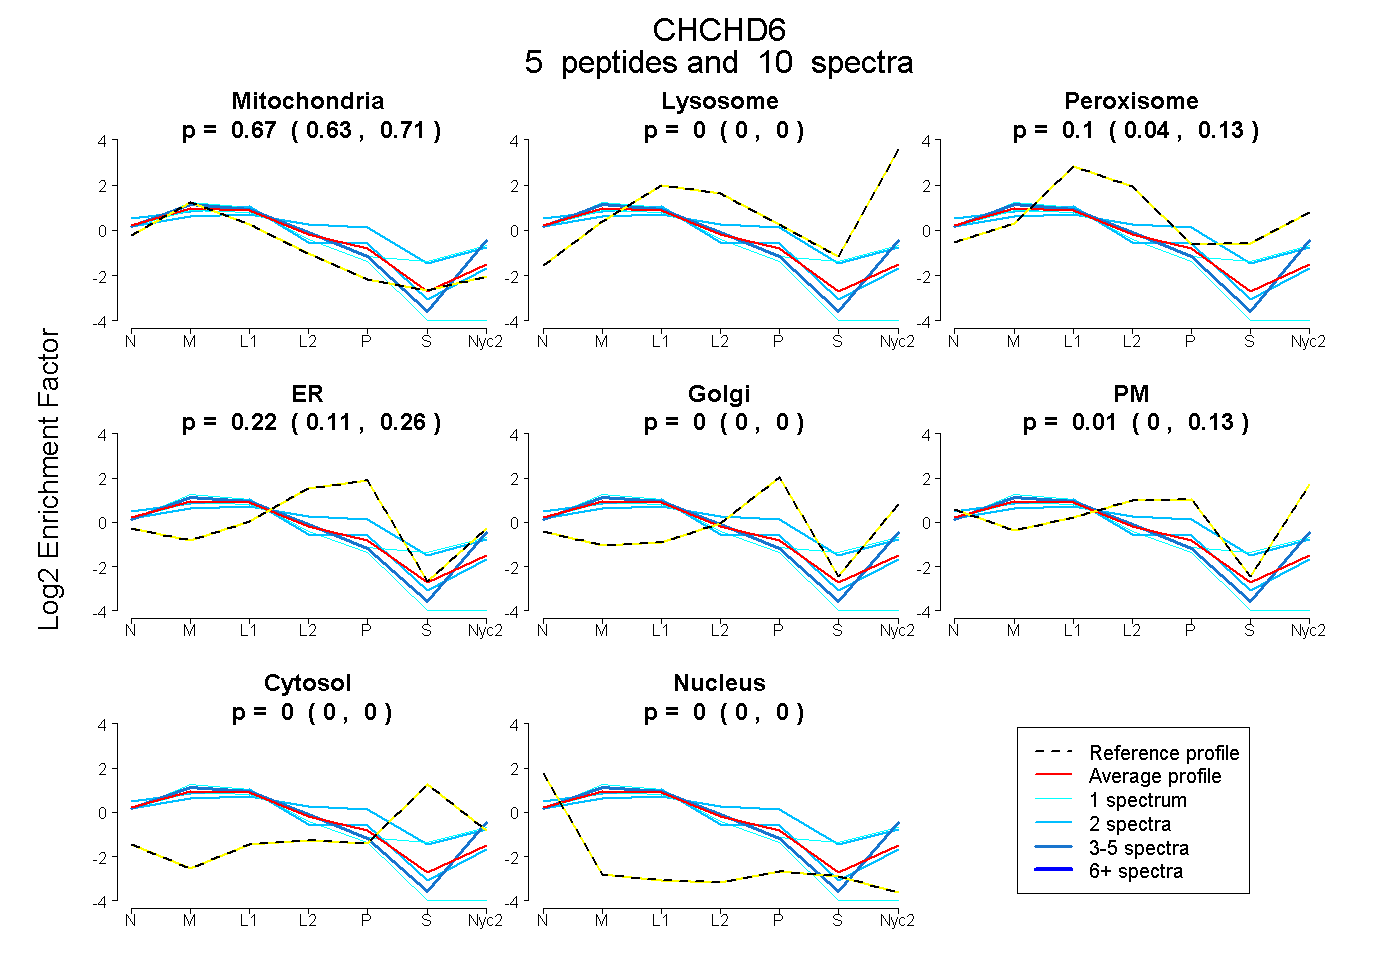
0.627 | 0.705
0.000 | 0.000
0.036 | 0.133
0.109 | 0.262
0.000 | 0.000
0.000 | 0.135
0.000 | 0.000
0.000 | 0.000
1peptide
spectra
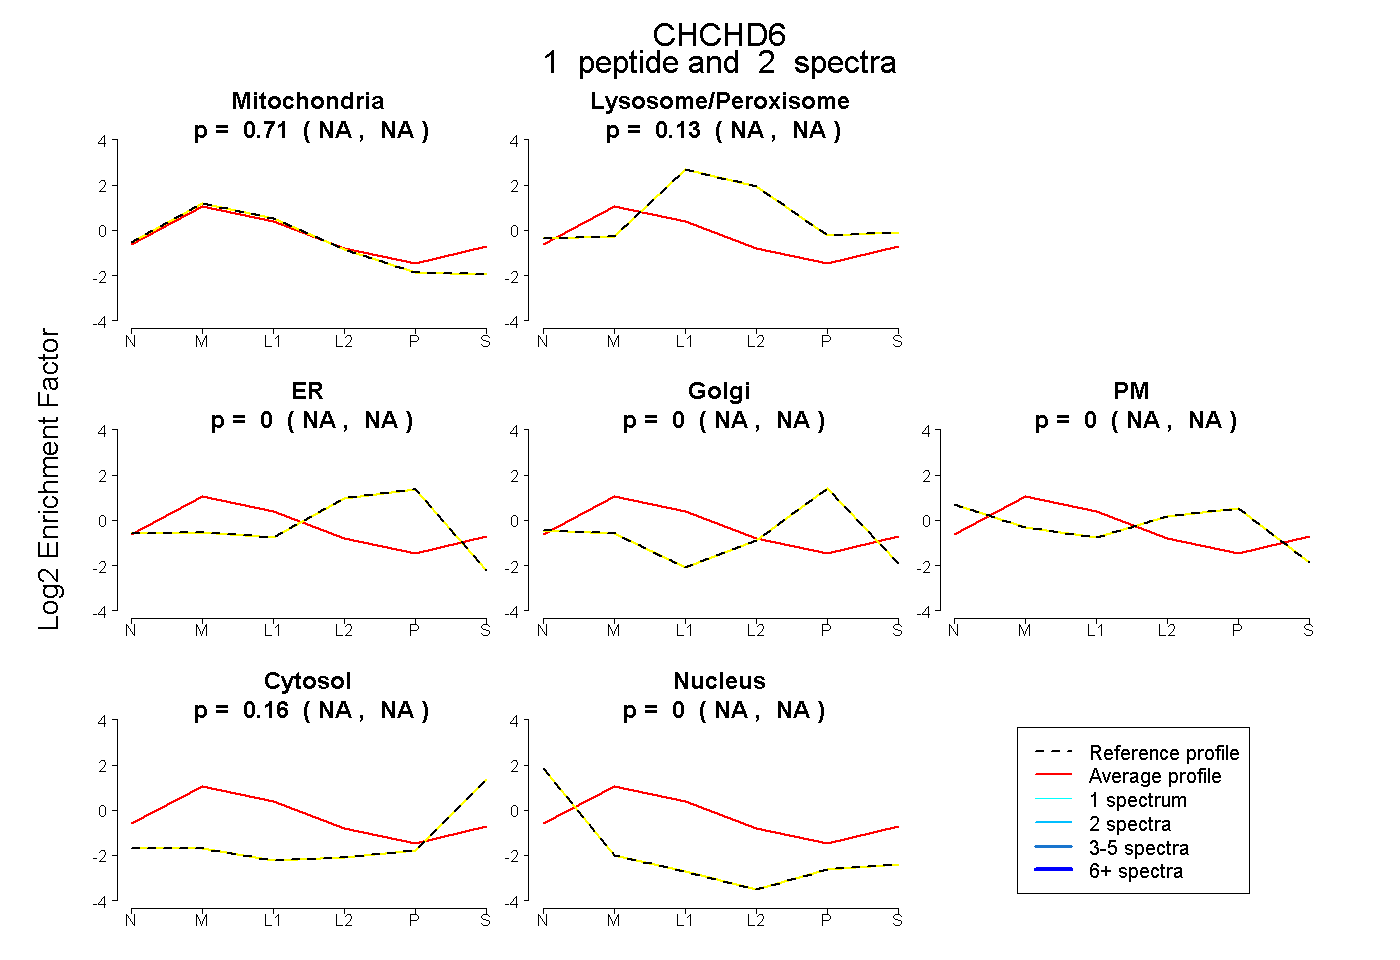
NA | NA
NA | NA
NA | NA
NA | NA
NA | NA
NA | NA
NA | NA
11peptides
spectra
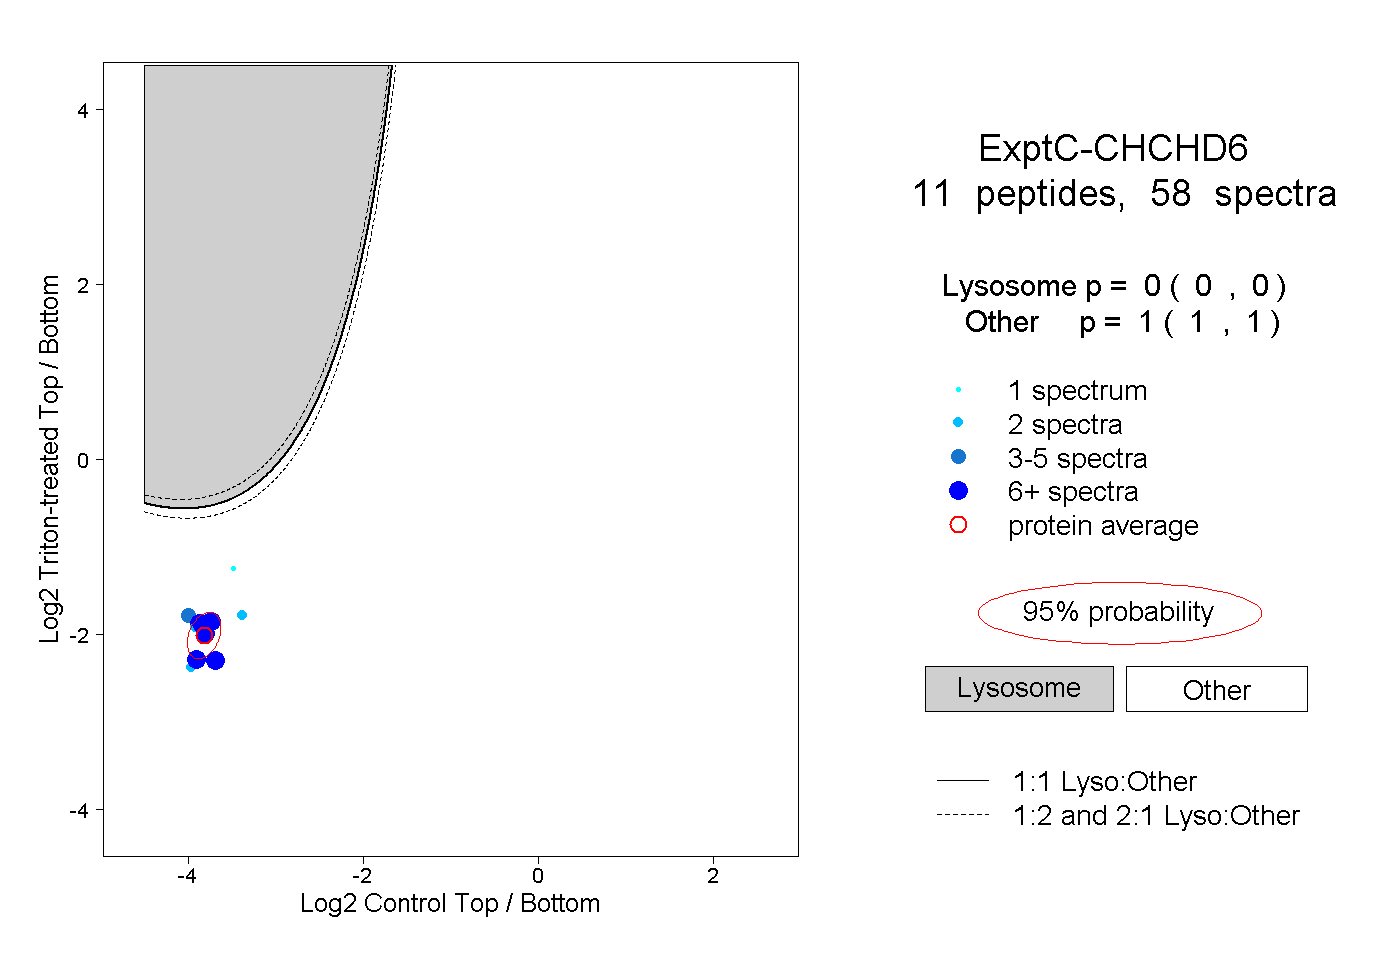
0.000 | 0.000
1.000 | 1.000
4peptides
spectra
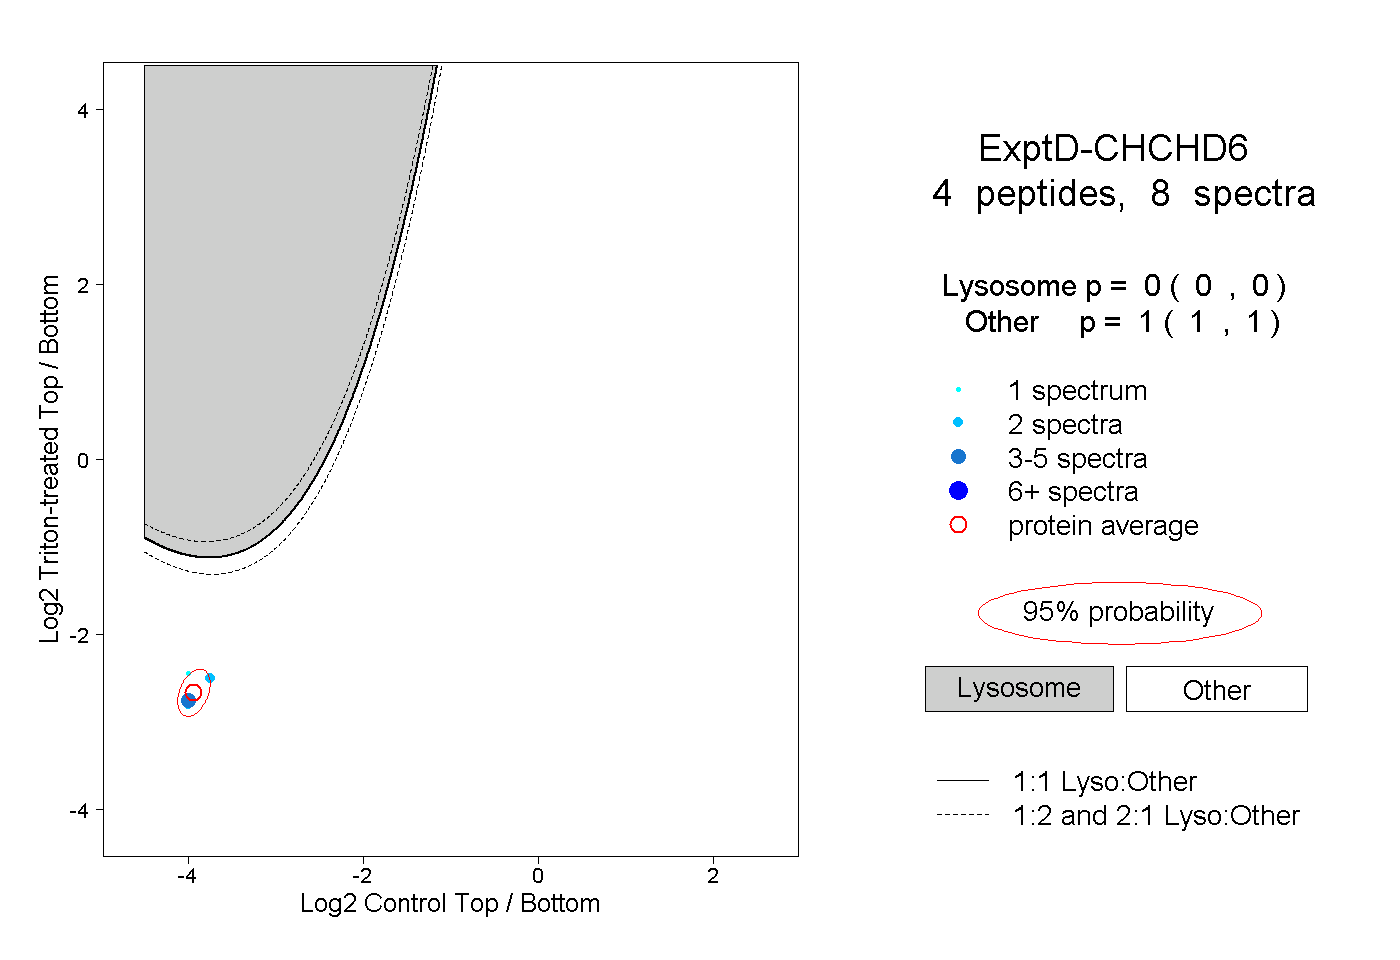
0.000 | 0.000
1.000 | 1.000