 2
2peptides
spectra
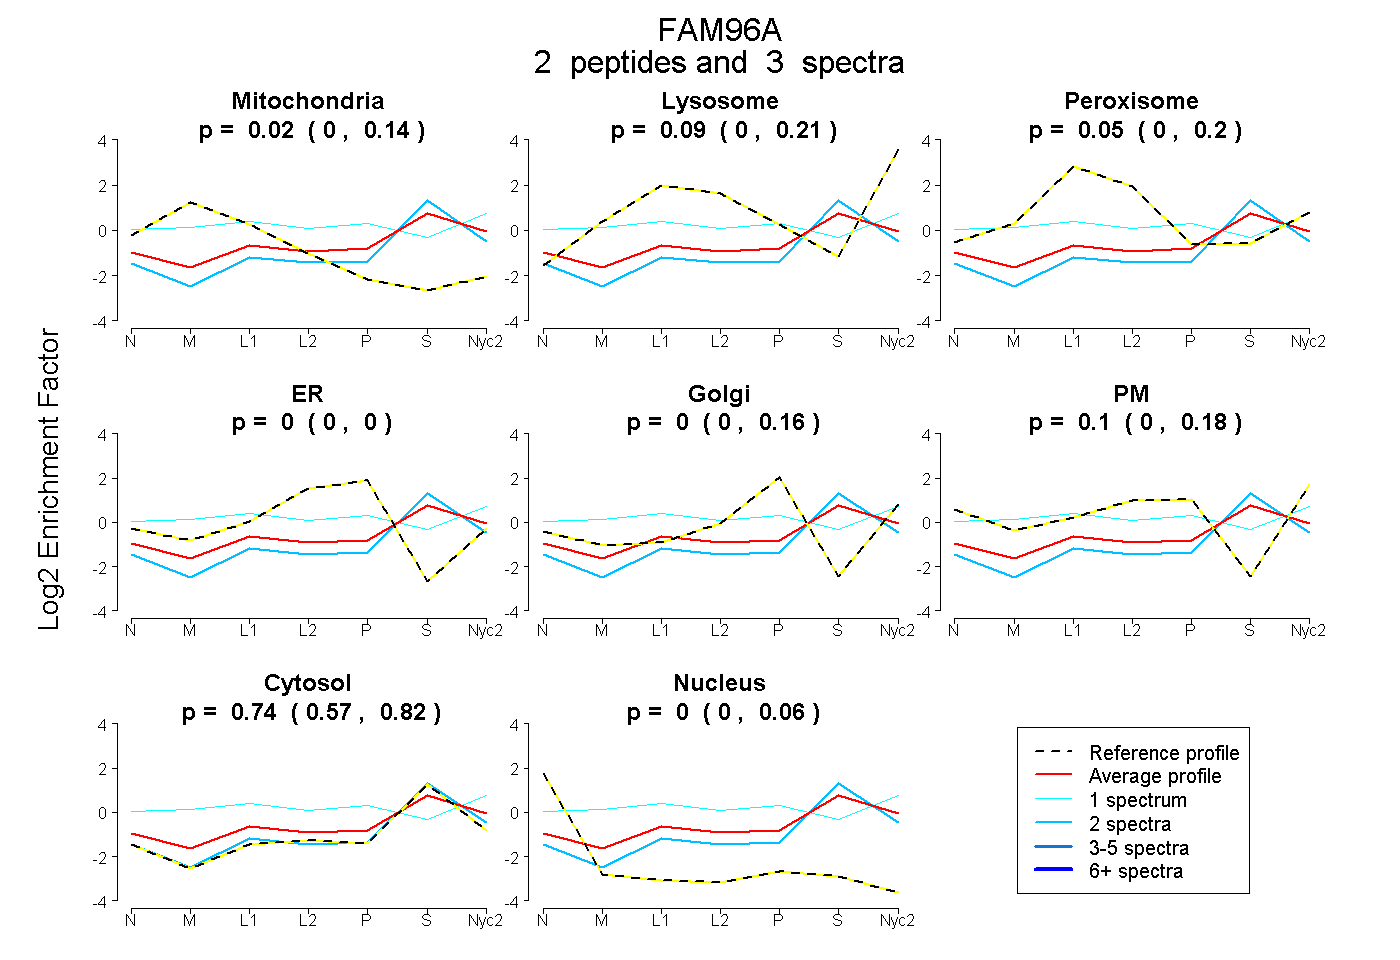
0.000 | 0.142
0.000 | 0.215
0.000 | 0.200
0.000 | 0.000
0.000 | 0.160
0.000 | 0.177
0.574 | 0.818
0.000 | 0.058
1peptide
spectra
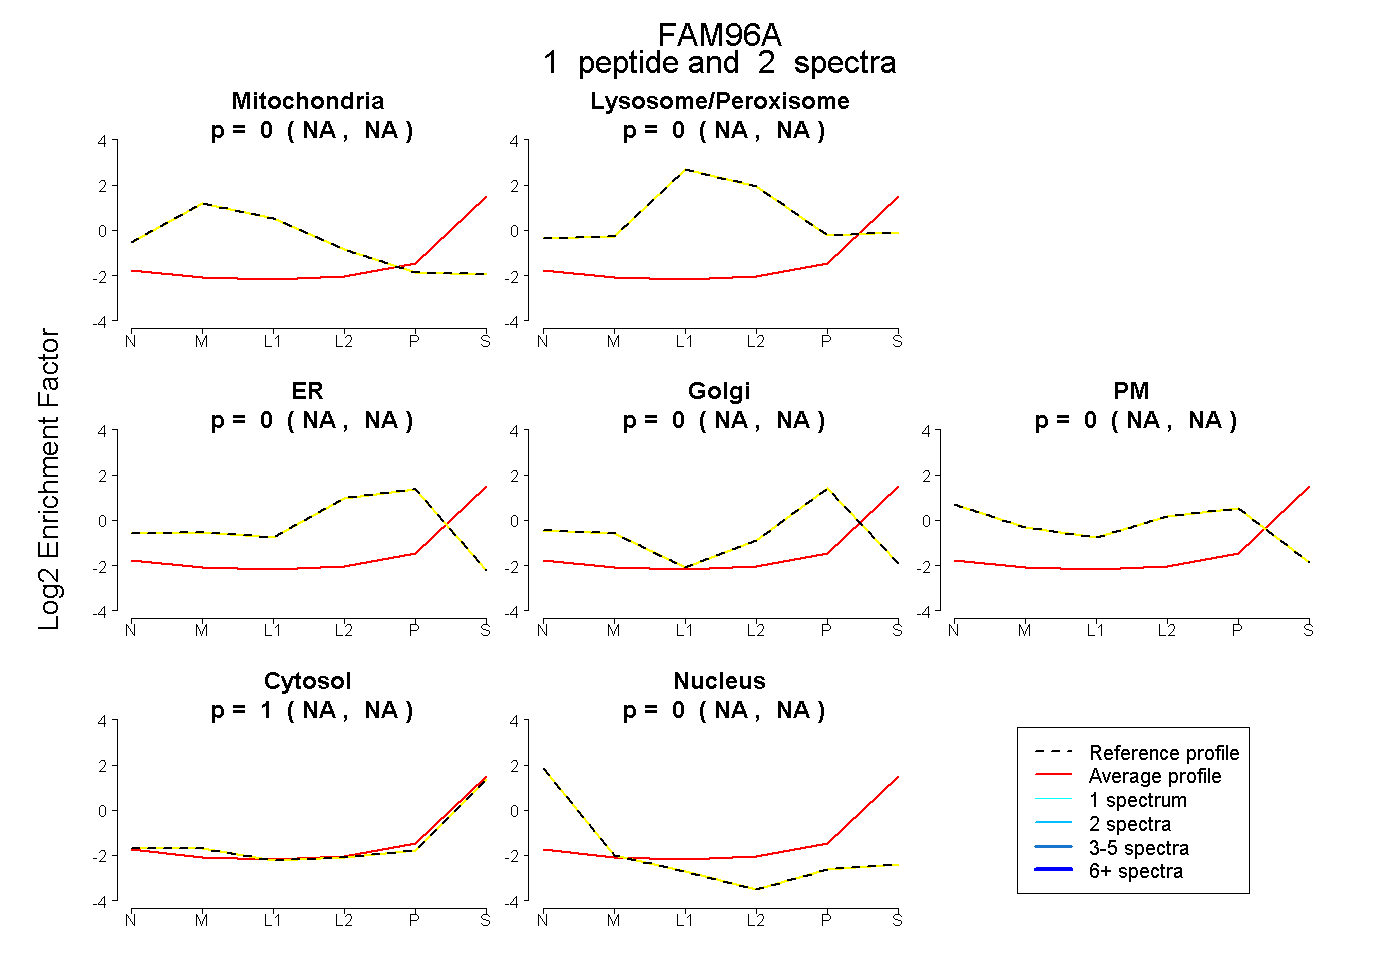
NA | NA
NA | NA
NA | NA
NA | NA
NA | NA
NA | NA
NA | NA
1peptide
spectra
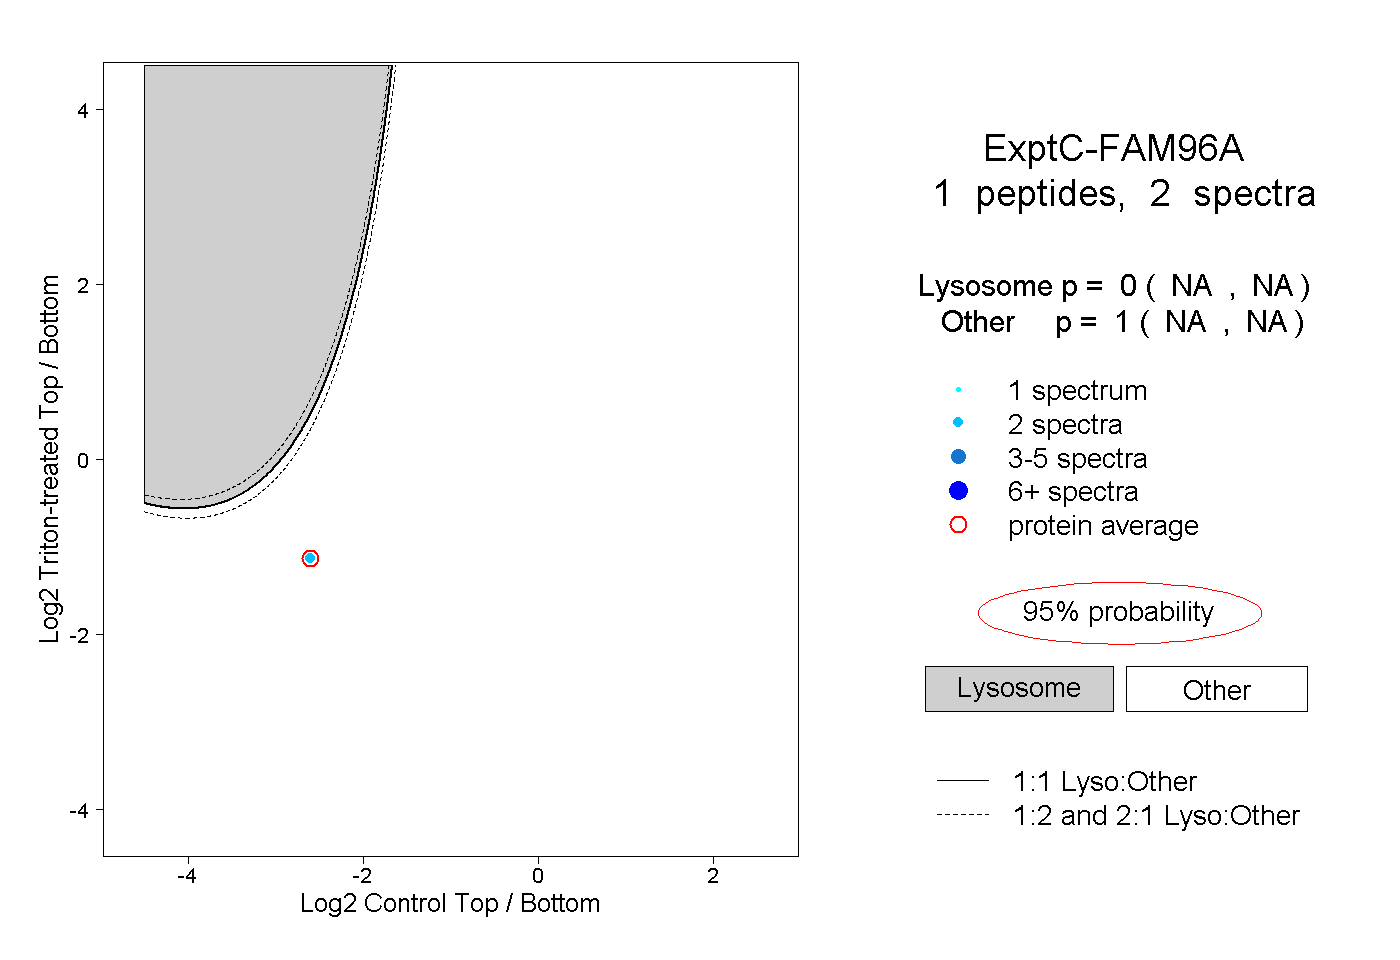
NA | NA
NA | NA