 2
2peptides
spectra
0.000 | 0.142
0.000 | 0.215
0.000 | 0.200
0.000 | 0.000
0.000 | 0.160
0.000 | 0.177
0.574 | 0.818
0.000 | 0.058
| Plot | Mito | Lyso | Perox | ER | Golgi | PM | Cytosol | Nucleus | |||||
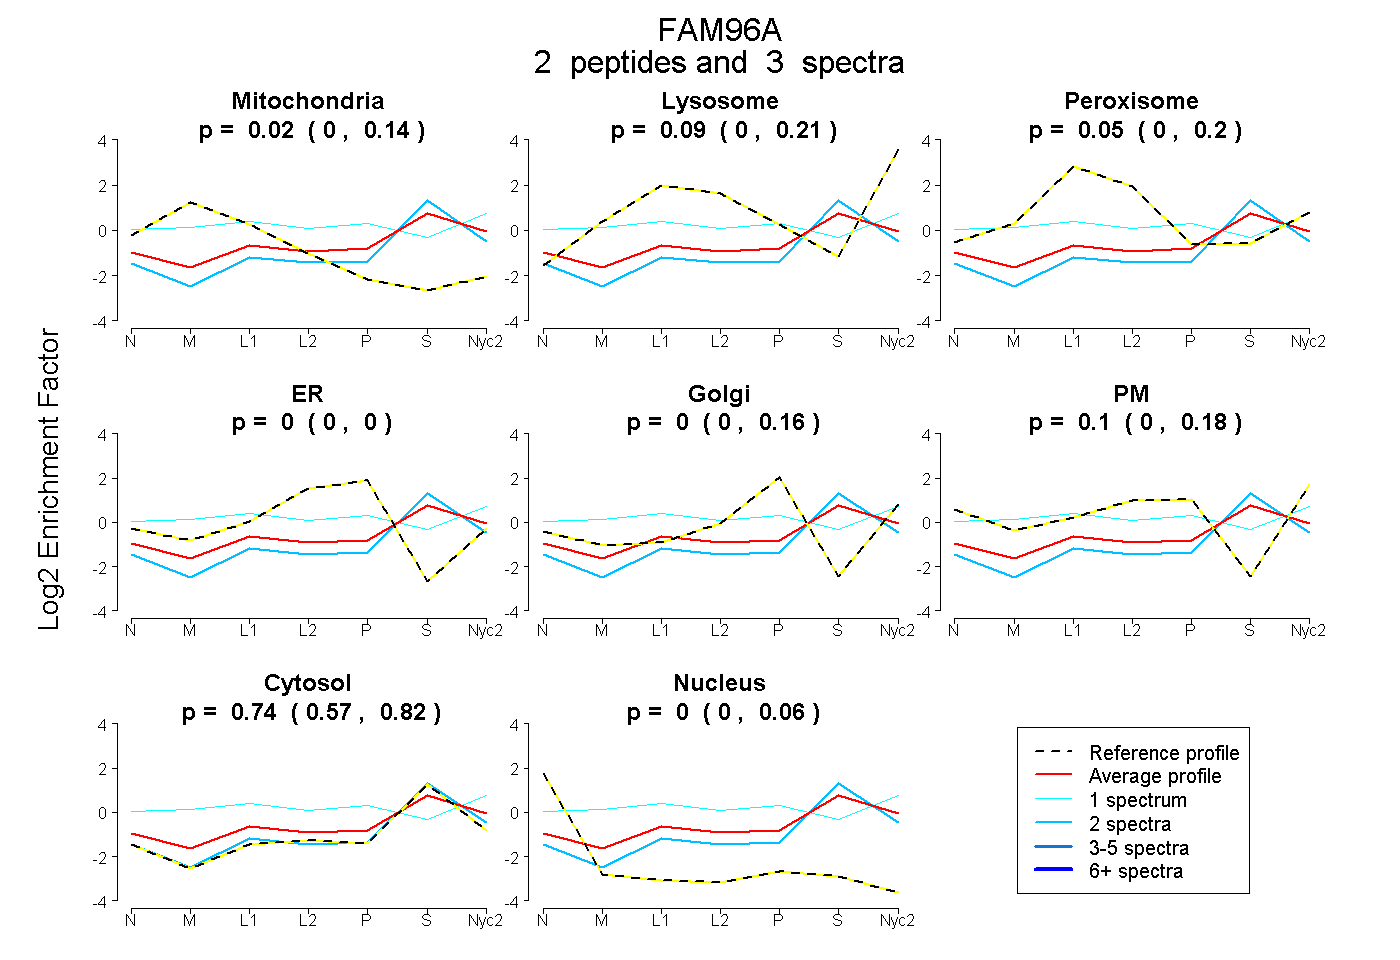
| Expt A |
2 peptides |
3 spectra |
|
0.017 0.000 | 0.142 |
0.086 0.000 | 0.215 |
0.053 0.000 | 0.200 |
0.000 0.000 | 0.000 |
0.000 0.000 | 0.160 |
0.100 0.000 | 0.177 |
0.744 0.574 | 0.818 |
0.000 0.000 | 0.058 |
| 1 spectrum, EIVEQCVLEPD | 0.054 | 0.044 | 0.251 | 0.000 | 0.055 | 0.351 | 0.245 | 0.000 | ||
| 2 spectra, ALEVYDLIR | 0.000 | 0.036 | 0.000 | 0.000 | 0.000 | 0.000 | 0.964 | 0.000 |
| Plot | Mito | Lyso or Perox | ER | Golgi | PM | Cytosol | Nucleus | ||||||
| Expt B |
1 peptide |
2 spectra |
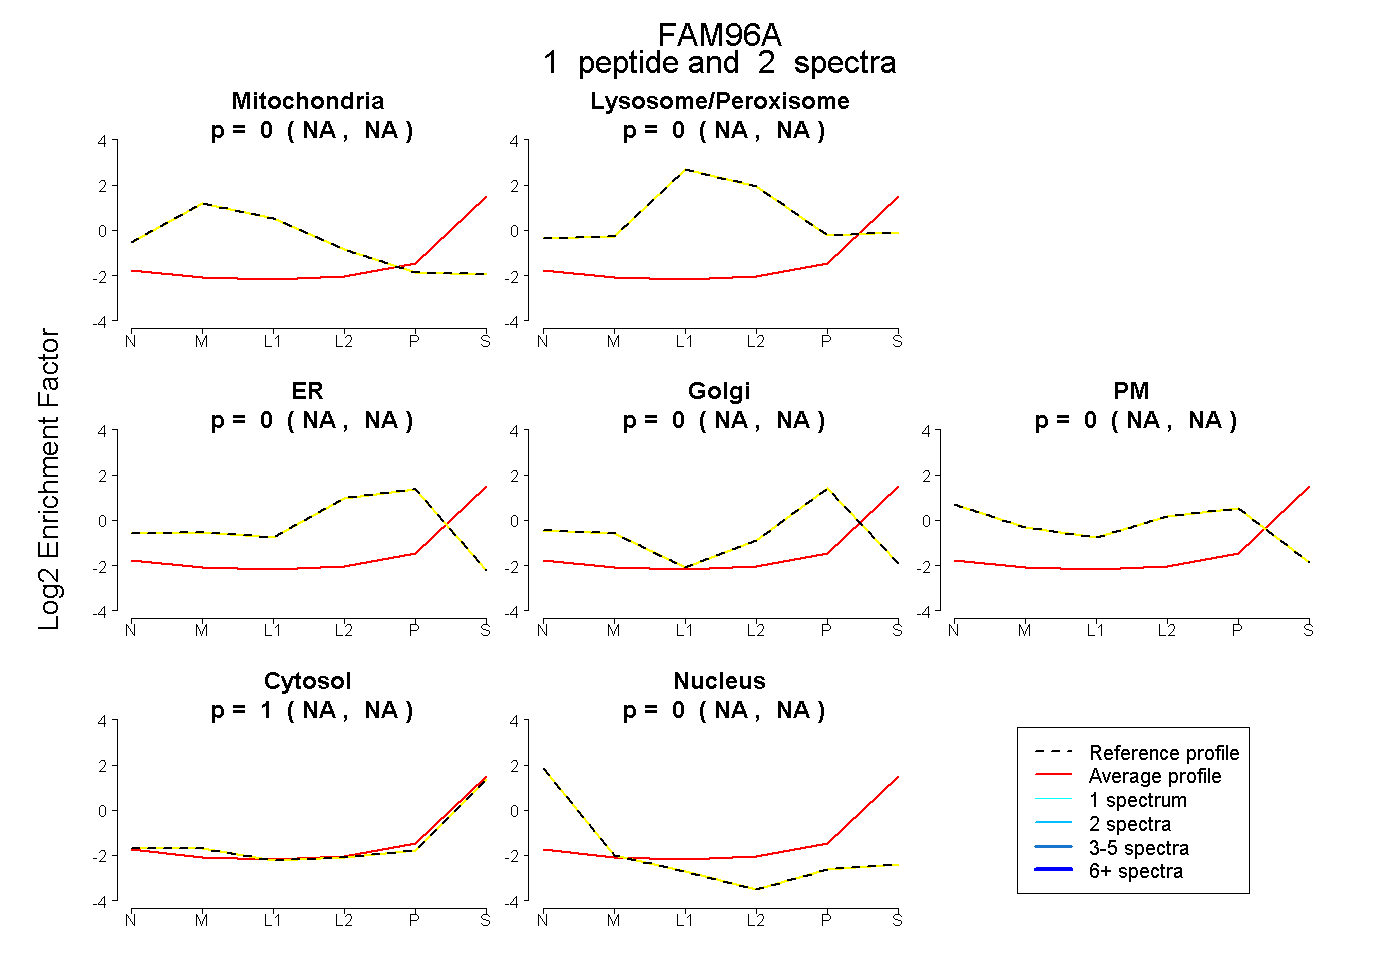 |
0.000 NA | NA |
0.000 NA | NA |
0.005 NA | NA |
0.000 NA | NA |
0.000 NA | NA |
0.995 NA | NA |
0.000 NA | NA |
|||
| Plot | Lyso | Other | |||||||||||
| Expt C |
1 peptide |
2 spectra |
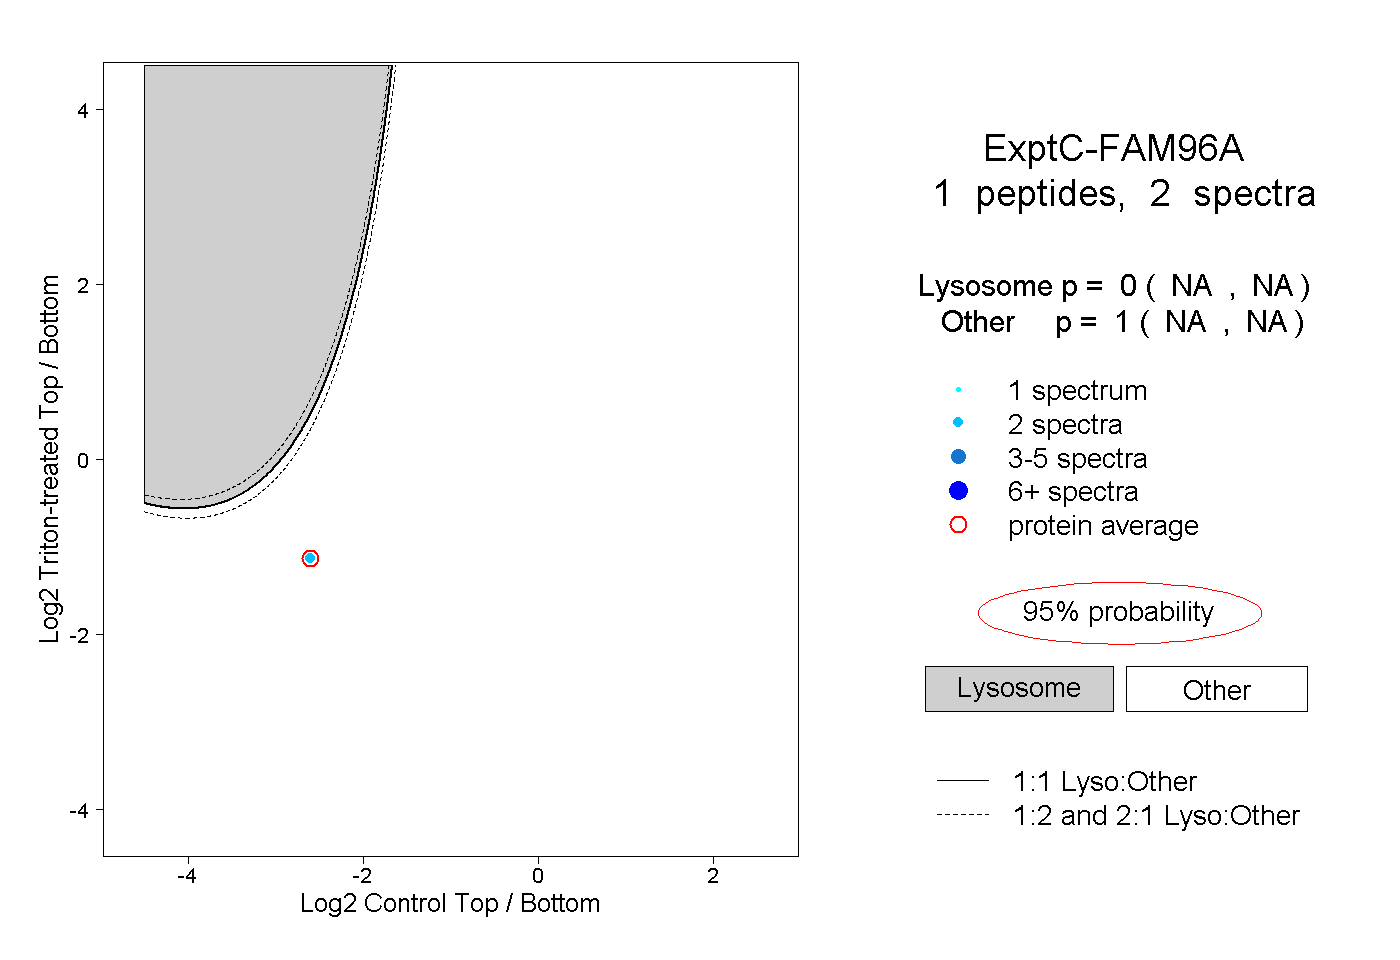 |
0.000 NA | NA |
1.000 NA | NA |