 12
12peptides
spectra
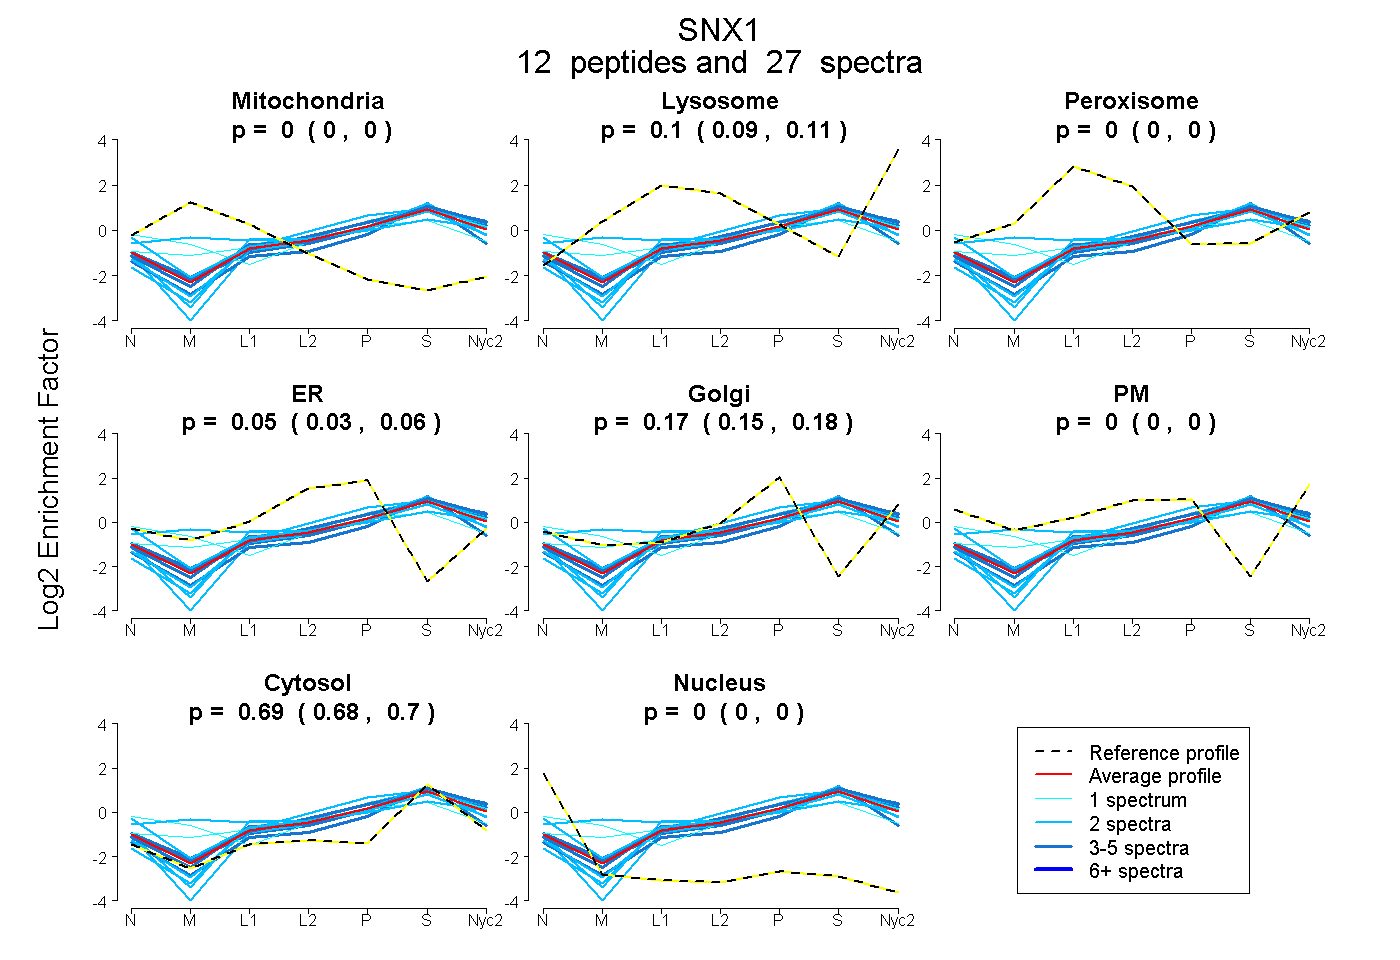
0.000 | 0.000
0.089 | 0.106
0.000 | 0.000
0.031 | 0.058
0.150 | 0.177
0.000 | 0.000
0.684 | 0.697
0.000 | 0.000
3peptides
spectra
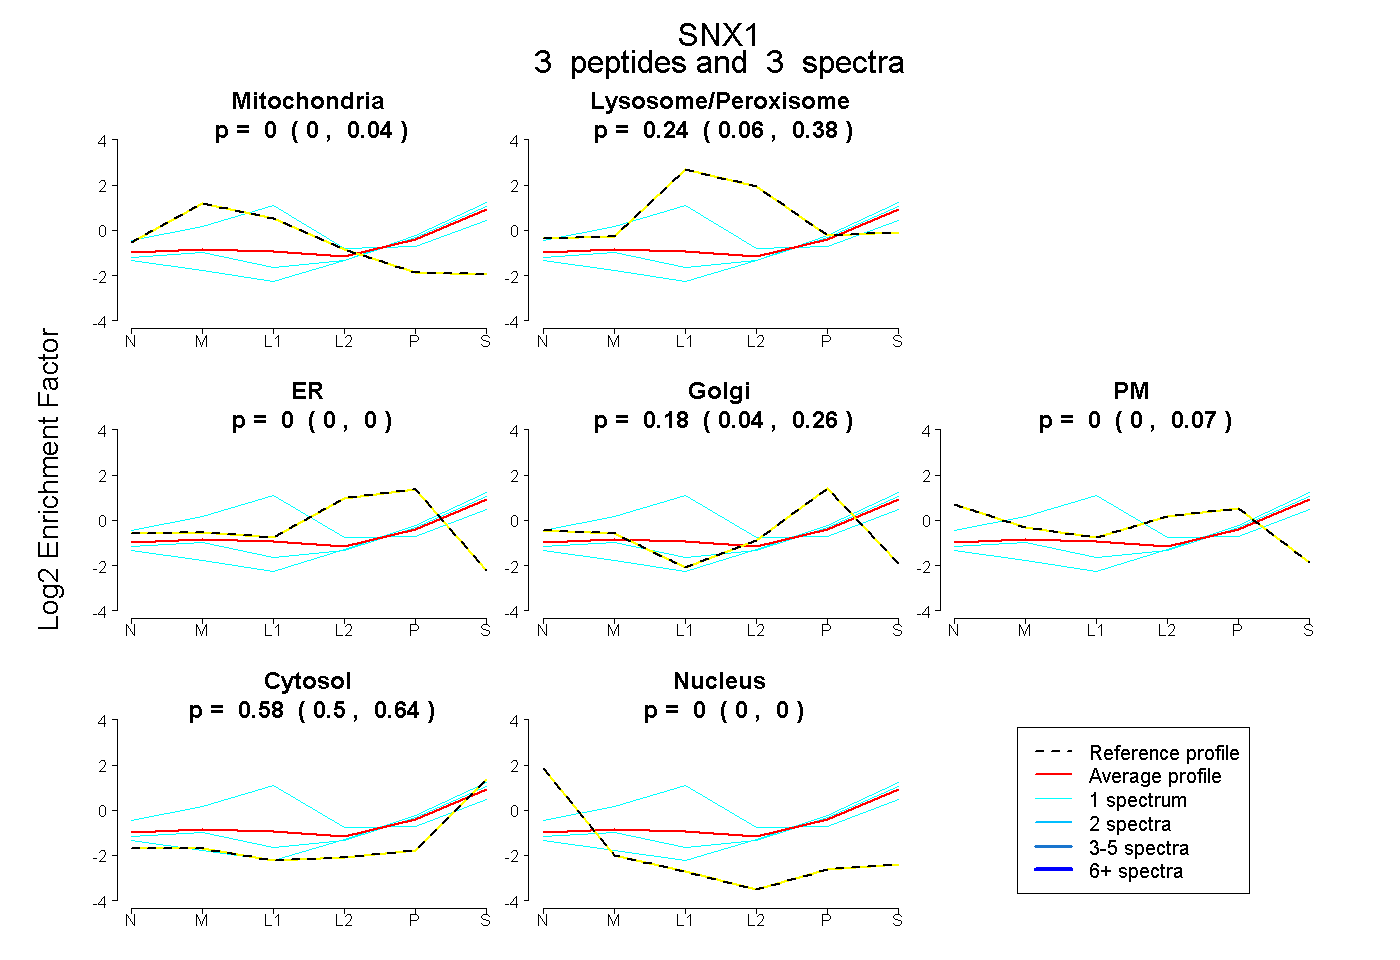
0.000 | 0.042
0.056 | 0.377
0.000 | 0.000
0.044 | 0.258
0.000 | 0.069
0.497 | 0.642
0.000 | 0.000
14peptides
spectra
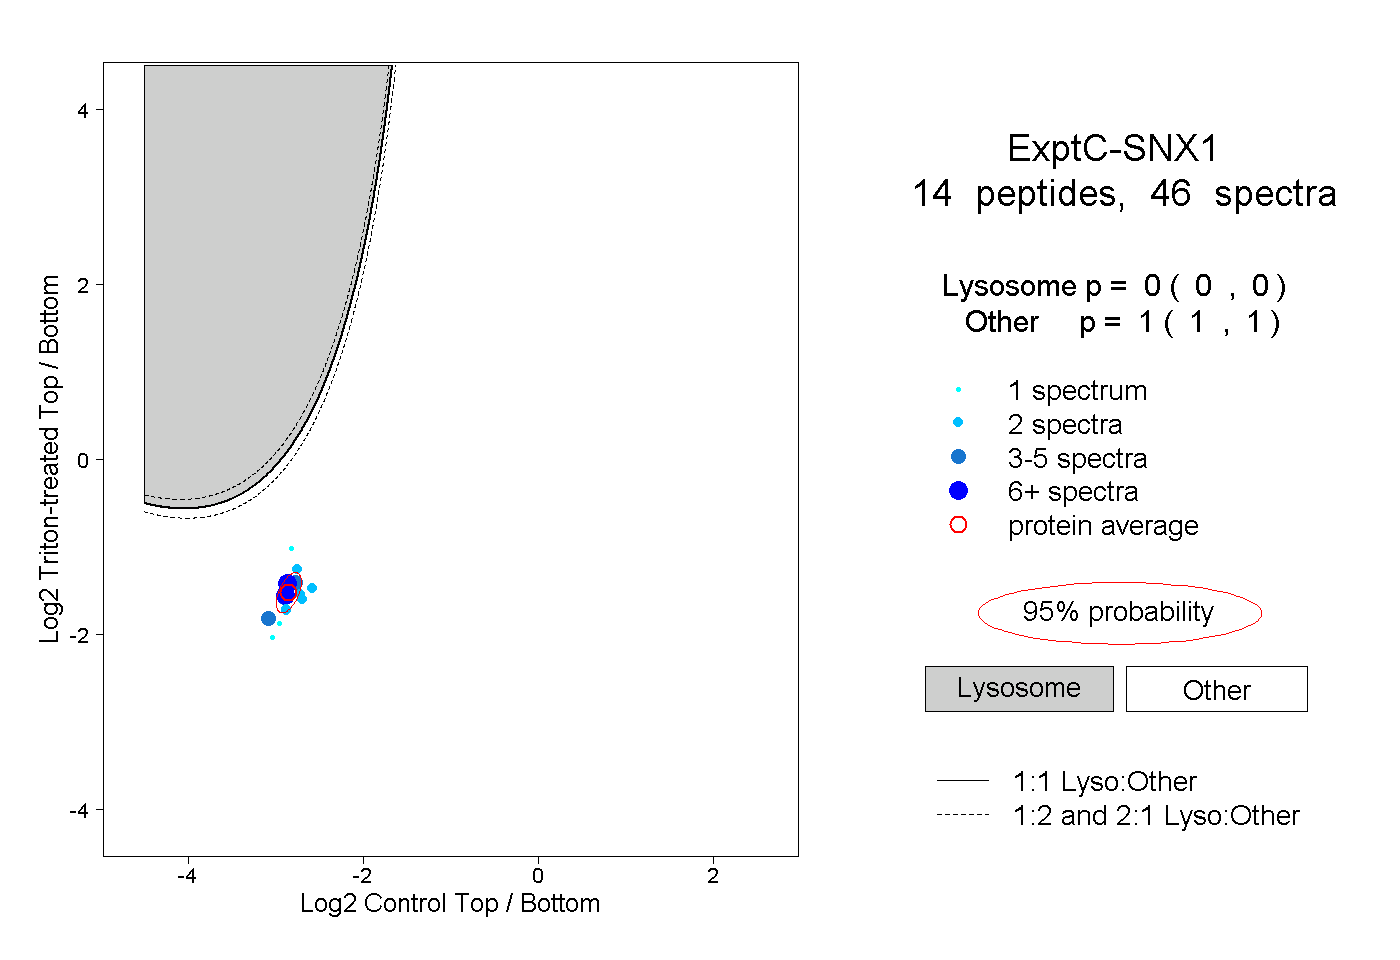
0.000 | 0.000
1.000 | 1.000
4peptides
spectra
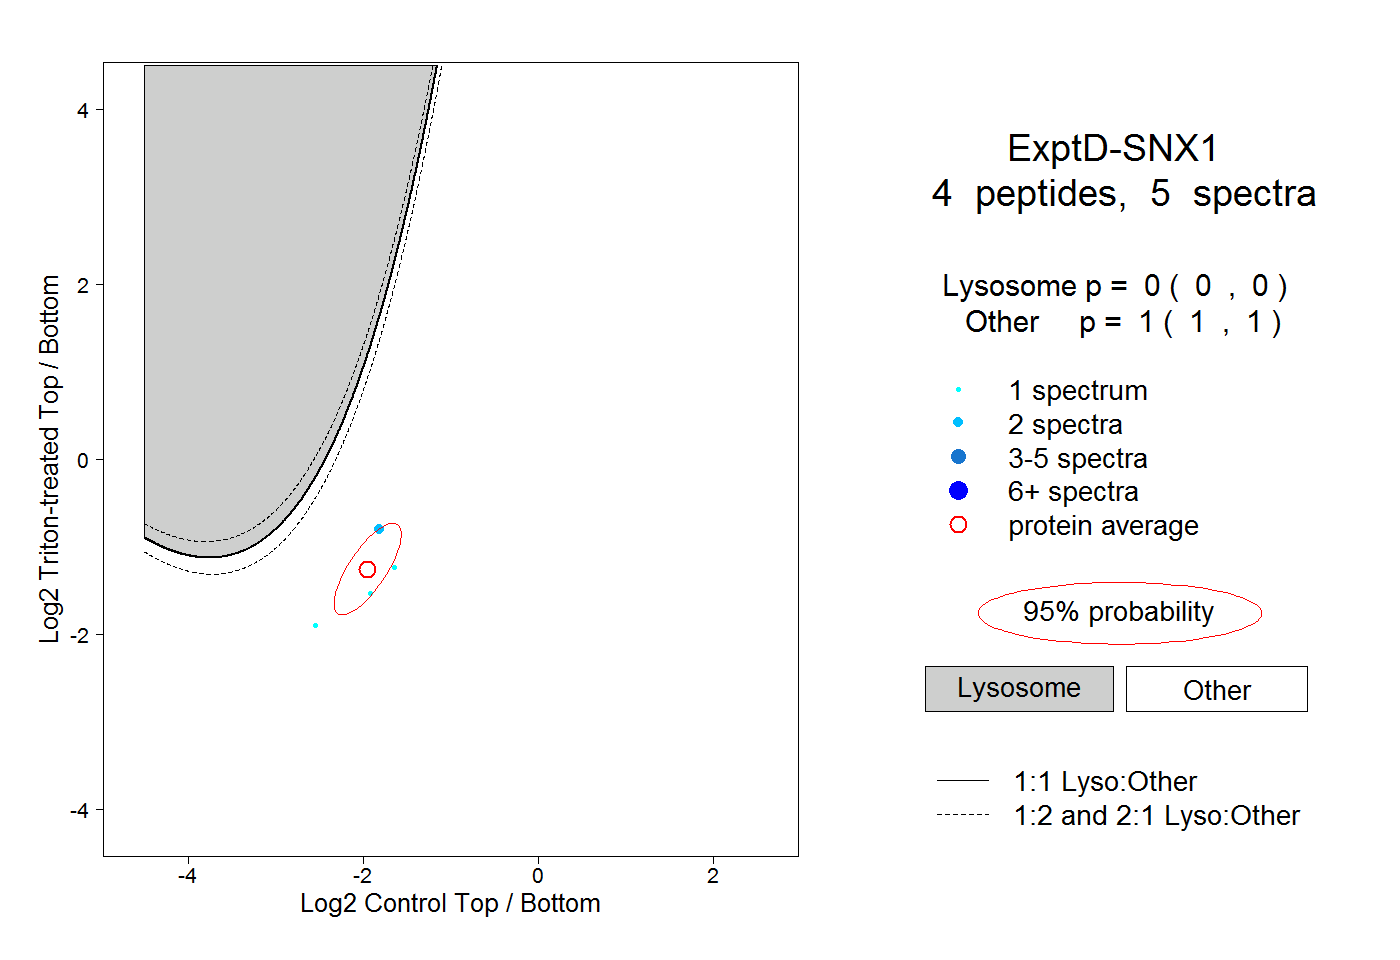
0.000 | 0.000
1.000 | 1.000